
The Hook Pattern is an analytical pattern in financial markets that indicates potential changes in price trends. In technical analysis, particularly in price action, this pattern helps traders identify optimal entry and exit points. The structure of the Hook Pattern typically involves a price movement followed by a minor retracement before continuing in the direction of the previous trend. This temporary retracement forms the "hook," which traders use to confirm the new trend and enter a trade accordingly.
Features of the Hook Pattern
Here are the key features of the Hook Pattern:
1. Identifying Trends and Price Corrections
One of the most important characteristics of this pattern is that it represents a temporary correction within a broader trend. The price initially moves in one direction, experiences a short correction, and then resumes its primary movement. This feature helps traders identify better entry and exit points.
2. Applicable in Both Uptrends and Downtrends
The Hook Pattern is effective in both bullish and bearish trends:
A Bullish Hook forms on the chart when, after a significant upward movement, the price experiences a temporary decline but then resumes its upward trend. This structure typically indicates price consolidation and the continuation of the bullish trend.
A Bearish Hook appears when, following a sharp price drop, the market experiences a temporary upward retracement but then continues its downward trend. This pattern is usually a signal of further price decline and can present a favorable opportunity for bearish traders.
3. Flexibility Across Different Timeframes
Another key advantage of this pattern is its presence across all timeframes. Whether you are a scalper trading on smaller time frames like 5 minute or 15 minute charts, or a swing trader working with higher time frames such as 4 hour or daily charts, the Hook Pattern can help you accurately analyze market corrections.
4. Combination with Other Analytical Tools
To enhance the accuracy of Hook Pattern signals, traders can combine it with technical indicators such as: Moving Average (MA), Bollinger Bands, Relative Strength Index (RSI), MACD
Integrating these tools increases the confirmation of trade entries and minimizes potential errors.
5. Low Risk Opportunities with a Favorable Risk to Reward Ratio
The Hook Pattern typically indicates low risk entry points, as it forms near short term corrections. When correctly identified, it allows traders to set a tight Stop Loss and a reasonable Take Profit, resulting in a favorable Risk/Reward Ratio.
6. Applicable in Various Financial Markets
Another advantage of this pattern is its usability across different financial markets, including: Forex (Foreign Exchange), Cryptocurrency (Crypto), Stocks and Futures Markets.
Traders can use the Hook Pattern to predict price movements and improve their trading strategies.
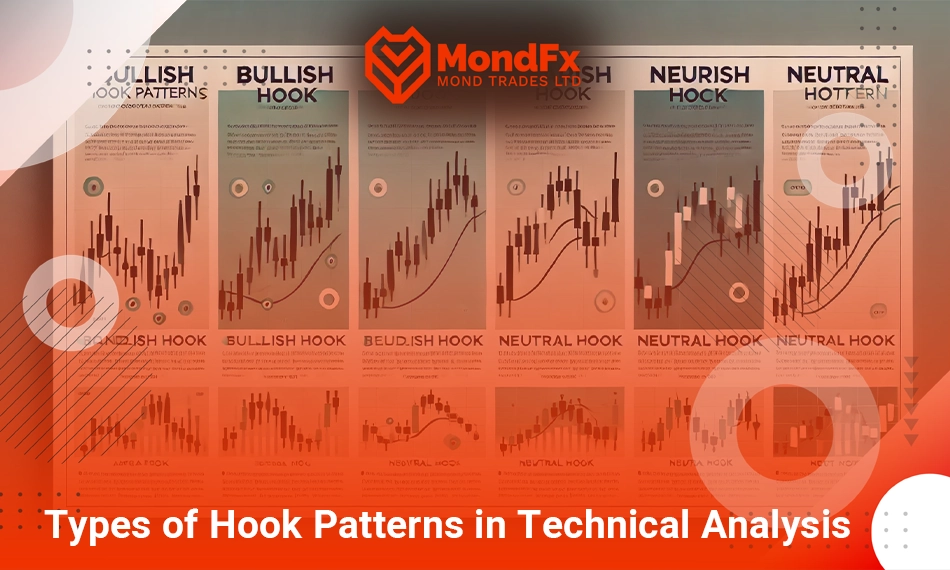
Types of Hook Patterns in Technical Analysis
This pattern has different types, each providing specific signals. Below, we will examine them:
1. Bullish Hook Pattern
This pattern forms when the price in an uptrend experiences a minor correction and then resumes its upward movement. This correction usually occurs due to the temporary exit of traders from the market or a brief pause in the trend. In this pattern, after the correction ends and the price reversal is confirmed, a buy position can be taken. The key characteristics of this pattern include an initial upward move, a short term correction, and then the continuation of the uptrend.
The bullish hook pattern typically forms near a support level and is confirmed by indicators such as RSI or moving averages.
2. Bearish Hook Pattern
This pattern occurs in a downtrend. After a price decline, a corrective upward movement takes place, followed by a continuation of the downward trend.
Once the correction is complete and the price decline is confirmed, a sell position can be taken. The bearish hook pattern typically appears near a resistance level and is confirmed by tools such as RSI divergence or a trendline breakout.
3. Sideways Hook Pattern
This pattern occurs when the market is in a sideways phase without a clear direction, and the price moves within a fixed range. This pattern is used for trading support and resistance levels or waiting for a breakout of one of these levels.Characteristics of the Sideways Hook Pattern:The price oscillates between a support and resistance level.
Small corrections form within the price channel.
Suitable for range based trading strategies.
4. Neurial Hook pattern
The Neurial Hook pattern is a candlestick pattern in technical analysis that indicates a phase of consolidation or a potential trend reversal in the market. This pattern typically appears when the price, after an upward or downward movement, starts fluctuating and shows signs of uncertainty among buyers and sellers.
Key characteristics of this pattern include short candlestick wicks, a relatively small body, and reduced price volatility, often appearing at the end of a trend. Traders use this pattern to identify smart entry or exit points in the market, especially when confirmations from other technical indicators are present.
5. Complex Hook Pattern
This pattern forms when the corrective movement is deeper than usual hooks and consists of multiple corrective waves.
Multi stage corrections within an overall trend and the need for stronger confirmation through multi timeframe analysis are key features of this pattern. Additionally, the Complex Hook Pattern may be a combination of several technical patterns. For using this pattern, it is better to obtain stronger confirmations from indicators or trading volume before entering a trade.
6. Combination Hook Pattern
This pattern forms when multiple hooks appear simultaneously in different timeframes, providing a stronger signal. To apply this pattern, analyzing multiple timeframes and entering trades based on stronger confirmation signals is required.Characteristics of the Combination Hook Pattern:A combination of short term and long term hooks.
Indicates fundamental changes in the trend.
Requires more detailed analysis before entering a trade.
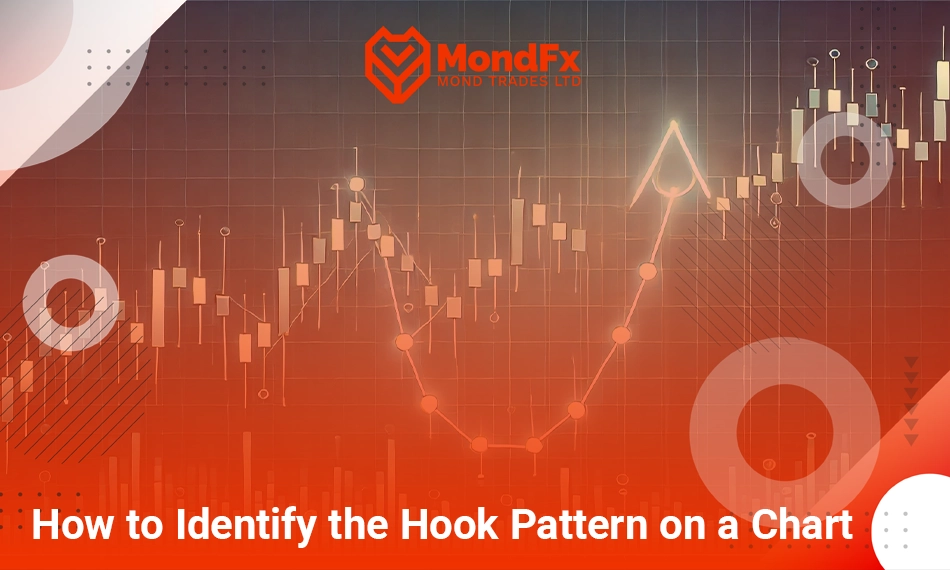
How to Identify the Hook Pattern on a Chart
To identify the Hook Pattern, applying the following principles is essential:
1. Understanding the Structure of the Hook Pattern
The hook pattern forms in both bullish and bearish trends and consists of three main parts: a strong movement in the direction of the main trend (either upward or downward). a short and temporary price correction, which appears in the shape of a hook. The continuation of the main trend after the correction ends.Note:The correction should not be too deep to completely reverse the trend; it should only be a temporary pause in the price movement.
2. Steps to Identify the Hook Pattern on a Chart
Analyzing the overall trend:First, determine whether the price is in an uptrend or downtrend using trendlines, moving averages, and the structure of highs and lows.Identifying the minor correction:look for candles indicating a slowdown in the main trend. These candles typically have lower volume and limited retracement.Observing the end of the correction:After spotting a correction, wait for the price to break out of it and resume the previous trend.Final confirmation:Before entering a trade, use additional tools to confirm the Hook Pattern.
3. Observing Price Levels and Market Volatility
To understand this pattern better, it's important to carefully analyze price fluctuations:Retracement levels and correction range:In bullish hooks, the correction usually occurs within the 38.2% to 50% Fibonacci retracement range. In bearish hooks, the same Fibonacci levels are used to analyze the correction depth.Volatility in the correction:If the correction exceeds 50% of the previous move, there is a possibility of a trend reversal, and it will no longer be considered a valid hook pattern.Candlestick signals for trend continuation:After the correction ends, a strong reversal candle (such as a bullish engulfing or bearish engulfing candle) typically appears, confirming the continuation of the main trend.
4. Using Technical Indicators for Pattern Confirmation
To increase accuracy in identifying the Hook Pattern, traders should use certain technical indicators for confirmation:Moving Average (MA):If the price reacts to the 20 period or 50 period moving average, it can signal the end of the correction and the continuation of the trend.Relative Strength Index (RSI):In a bullish hook, RSI should not be in the oversold zone. In a bearish hook, RSI should not be in the overbought zone.MACD (Moving Average Convergence Divergence):If MACD convergence or divergence aligns with the end of the correction, the Hook Pattern becomes more reliable.Volume Analysis:an increase in volume as the price exits the correction suggests that traders are re entering the main trend.
5. Utilizing Trading Software for Better Pattern Recognition
For greater accuracy in analysis, using trading software can be beneficial:Trading View:We use Trading View to draw trendlines, apply Fibonacci retracements, and utilize indicators.Meta Trader 4 & 5:Meta Trader 4 and 5 are good options for analyzing charts in detail and identifying minor corrections.Ninja Trader & ThinkorSwim:These two analytical software are used for executing professional trades and conducting deeper analysis.
Trading Strategies Based on the Hook Pattern
The trading strategies based on the Hook Pattern include:
1. Trading Based on Support and Resistance
One of the primary uses of the Hook Pattern is utilizing support and resistance levels to confirm entry and exit points. In this method, key levels must first be identified on the chart.
In a bullish hook, the price briefly retraces, touches a support level, and then resumes its upward movement.
In a bearish hook, the price retraces, reaches a resistance level, and then declines again.Entry Method:Enter a trade after confirming price reversal near support or resistance.Stop Loss:Below the support level in a bullish hook and above the resistance level in a bearish hook.Take Profit:Next resistance level in a bullish hook and next support level in a bearish hook.
2. Combining with Moving Averages
Moving Averages (MA) are useful tools for confirming the Hook Pattern. The 20 period and 50 period moving averages are commonly used to identify trend reversals after price corrections.
In a bullish hook, if the price retraces, touches the moving average, and then moves upward again, the buy signal becomes stronger.
In a bearish hook, if the price retraces, touches the moving average, and then declines, a sell trade can be considered.How to enter with this Strategy:After confirming a price reversal from the moving average.Stop Loss:Below the moving average in a bullish hook and above it in a bearish hook.Take Profit:Depending on market conditions, at the next resistance or support level.
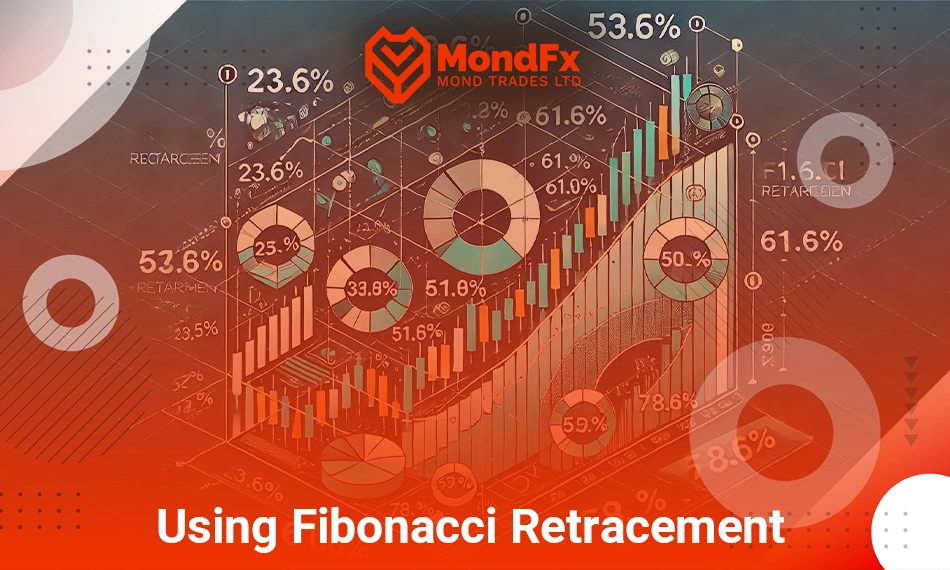
3. Using Fibonacci Retracement
Fibonacci retracement levels help identify potential correction zones where the price may resume its main trend.
In a bullish hook, the price usually retraces between 38.2% and 50% Fibonacci levels before resuming its upward trend.
In a bearish hook, after a retracement, the price stays within these levels before continuing downward.How to enter:Near a Fibonacci retracement level after a confirmation candlestick.How to set Stop Loss:Below the 61.8% Fibonacci level in a bullish hook and above it in a bearish hook.How to set Take Profit:At Fibonacci extension levels like 161.8%.
4. Using Bollinger Bands
Bollinger Bands help confirm the Hook Pattern and identify potential entry points.
In a bullish hook, if the price touches the lower Bollinger Band and then rebounds, a stronger buy signal is generated.
In a bearish hook, if the price reaches the upper Bollinger Band and then declines, a sell trade can be executed.Entry:enter a trade after observing a price reversal from Bollinger Bands.Stop Loss:Below the recent low in a bullish hook and above the recent high in a bearish hook.Take Profit:At the middle band or the opposite Bollinger Band.
5. Risk Management and Exit Strategies
Even the best trading strategies can result in losses without proper risk management. The essential principles for risk management in the Hook Pattern include:
Always set a Stop Loss: If the price moves against expectations, the trade should be exited. Maintain a minimum Risk to Reward ratio of 1:2 to ensure long term profitability. Adjust trade size according to capital and risk tolerance.
Advantages and Limitations of the Hook Pattern
Advantages:
1. Quick Identification of Trend Changes
This pattern is a powerful tool for traders, as it allows them to gain a better understanding of price behavior in the market. By using this pattern, traders can identify temporary corrections that occur within a larger trend.
One of the key advantages of this pattern is its ability to help determine optimal entry and exit points for trades. When the price is in an uptrend or downtrend, short term corrections can provide opportunities to enter at better price levels.
2. Suitable for Various Timeframes
This pattern, due to its high flexibility, can be used in various trading strategies. The hook pattern can be applied across all timeframes, including short term for scalping, where traders aim for small but frequent profits, and long term for swing trading. This versatility makes it a flexible tool for different trading strategies.
3. Can Be Combined with Other Analytical Tools
The hook pattern is most effective when used alongside other technical analysis tools. It can be combined with indicators, moving averages, support and resistance levels, Fibonacci retracements, and Bollinger Bands to enhance its reliability and generate more accurate trading signals.
4. Provides Low Risk Entry Points
One of the key advantages of this pattern is the ability to set small stop losses. Since the hook pattern typically forms after a temporary correction and before the continuation of the trend, traders can place their stop loss near the recent correction's high or low. This helps them limit potential losses in case of an unfavorable price movement while still maintaining the opportunity for profit.
5. Applicable in All Financial Markets
The hook pattern is a technical analysis pattern that, due to its unique structure, can be used in various financial markets driven by supply and demand. This pattern can be applied in the forex market, stock market, cryptocurrency market, and even futures trading.Limitations:1. Requires Additional Confirmation
The hook pattern, like many other technical analysis patterns, cannot always provide accurate and reliable signals on its own. If this pattern is used without combining it with other analytical tools, it may generate false signals, which can lead to trading mistakes.
2. Less Effective in Volatile Markets
In financial markets, identifying price patterns and making decisions based on them largely depend on overall market conditions. The hook pattern is no exception, and its effectiveness is highly dependent on the presence of a clear trend. When the market lacks a clear trend or experiences high volatility, identifying this pattern becomes more difficult, increasing the likelihood of false signals.
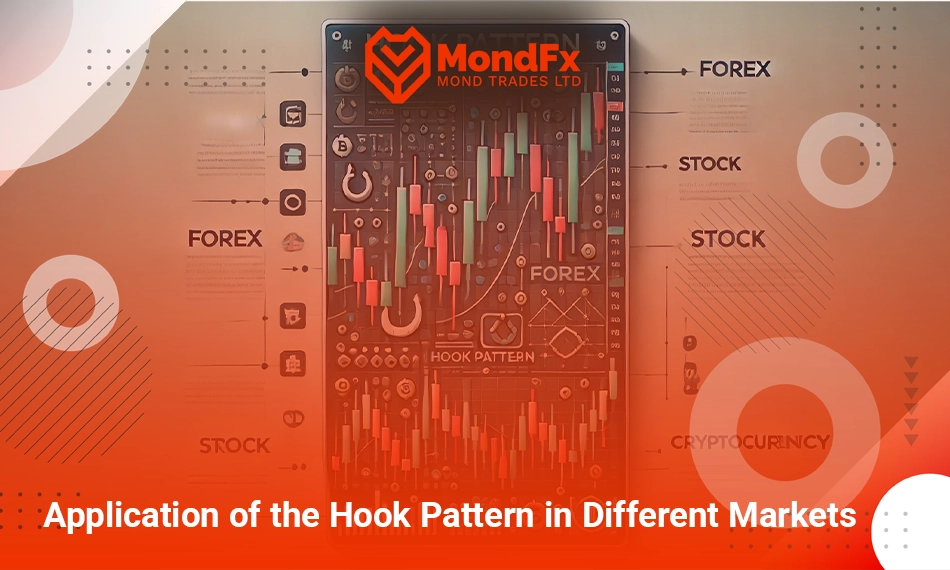
Application of the Hook Pattern in Different Markets
The Hook Pattern is widely applicable across various financial markets. Below are its key uses:
1. Forex Market
The high liquidity and constant volatility in Forex make the Hook Pattern an effective tool for identifying entry and exit points. In highly volatile pairs like Gold (XAU/USD) and EUR/USD, this pattern helps traders spot short term corrections and trade in line with the main trend. In strong bullish or bearish trends, the Hook Pattern provides low risk entry points with tight stop losses.
2. Stock Market
In stock trading, the Hook Pattern helps traders analyze minor price corrections and enter optimal trades. In stocks with strong uptrends, a bullish hook can act as an ideal buy entry point. After short term corrections following major fundamental news releases, this pattern helps traders time their stock entries efficiently.
3. Cryptocurrency Market
Due to the high volatility and rapid price swings in crypto markets, the Hook Pattern serves as a valuable trading tool. In strong trends such as Bitcoin (BTC) and Ethereum (ETH), traders can use this pattern to re-enter bullish trends after minor corrections. Since crypto markets are highly emotion driven, combining the Hook Pattern with volume analysis and momentum indicators enhances trade confirmation.
4. Commodities Market
For commodities like Gold, Silver, Oil, and Copper, the Hook Pattern helps traders identify corrective moves and trend continuation opportunities. In volatile commodities like Crude Oil, a bullish hook can offer a strong buy opportunity. In markets sensitive to economic news, this pattern helps identify short term corrections caused by macroeconomic data releases.
5. Indices Market
The Hook Pattern is useful in major indices like S&P 500, Dow Jones, DAX, and NASDAQ for identifying trend resumption after minor corrections. In long term uptrends, a bullish hook often provides good entry points. During economic events, this pattern helps traders identify continuation signals after short term pullbacks.
6. Futures and Options Market
Since timing is crucial in Futures and Options trading, the Hook Pattern helps identify optimal entry points. In commodity futures, it offers good buy and sell entry signals.
In options trading, it helps determine the best time to execute strategies like call and put options.
7. Algorithmic and Crypto Trading Bots
The Hook Pattern is commonly used in algorithmic trading as a confirmation factor for automated trading bots. Many Forex and Crypto trading bots use this pattern to identify entry points after short corrections. Combining this pattern with machine learning algorithms and AI based analysis can enhance entry and exit accuracy.
8. Emerging and Low Liquidity Markets
In low liquidity and emerging markets, the Hook Pattern helps traders detect irrational price fluctuations and false corrections. It is best combined with volume indicators to confirm true corrections from market manipulation. Professional traders use this pattern alongside fundamental and macroeconomic analysis for trading.