
Setting a Take Profit is one of the most important parts of a trading strategy in financial markets. Many beginner traders do not pay enough attention to this issue and focus solely on accurate entries, whereas lacking a precise plan for exiting a trade can eliminate potential profits or even lead to losses.
The Concept of Take Profit in Trading
Take Profit refers to a price level at which a trader decides to close a trade and lock in profits. This level is usually determined before entering the trade and is set within the trading platform. Properly setting a Take Profit prevents the trader from falling into greed or emotional decision making and ensures adherence to a logical, predetermined framework.
Risk/Reward Ratio and Its Impact on Take Profit
In financial market trading, sustainable success is not solely dependent on precise entries; it relies even more on smart risk and profit management. The Risk/Reward Ratio is one of the fundamental principles of capital management that plays a crucial role in a trader’s overall profitability. This ratio provides a clear framework for deciding on the Take Profit level and helps the trader avoid emotional behaviors.
Definition of Risk/Reward Ratio
The Risk/Reward Ratio expresses how much potential loss a trader is willing to accept in exchange for a certain amount of potential profit. This ratio is represented numerically; for instance, a 1:2 ratio means that for every unit of capital risked, there is an expectation of two units of profit. The aim of defining this ratio is to create a balance between profitability and risk in every trade.
Direct Relationship with Take Profit
When a trader sets a Stop Loss, the Take Profit must also be determined so that it fits within a reasonable Risk/Reward Ratio. For example, if a trade’s Stop Loss is 20 pips and the chosen Risk/Reward Ratio is 1:2, the Take Profit should be set at 40 pips. This approach not only helps create order in trading but also increases the likelihood of long term success, even if the win rate is relatively low.
The Impact of Market Type on Choosing the Ratio
The type of market and the behavioral nature of the asset being traded also play a role in setting this ratio. In highly volatile markets such as cryptocurrencies, higher ratios may be selected to compensate for greater risks. Conversely, in markets with more stable trends, like some major currency pairs, more conservative ratios are used. The more volatile the asset, the more crucial it becomes to set an appropriate Risk/Reward Ratio.
Alignment with Trading Strategy
The Risk/Reward Ratio should align with the trader’s strategy. Scalpers often follow ratios like 1:1 or 1:1.5, as they have many entry opportunities on lower time frames. However, for swing traders who operate over longer timeframes, ratios like 1:2 or even 1:3 can be reasonable, as there are fewer trades and each trade needs to yield more profit.
Long Term Results and the Importance of Sticking to the Ratio
One key point in using the Risk/Reward Ratio is maintaining consistency and sticking to it over the long term. Although some trades may exceptionally yield larger profits or close earlier than the set Take Profit, adhering to a defined framework helps create a regular behavioral pattern and reduces impulsive decision making. By maintaining logical and achievable ratios, even with a 50% win rate, sustainable profitability can be achieved, provided that the Take Profit is properly set and the Stop Loss is smaller.
Using Technical Levels to Set Take Profit
Technical analysis is one of the main tools traders use to predict market behavior and determine optimal entry and exit points. Among the various technical tools, support and resistance levels hold a special place and are used as a reliable basis for setting Take Profit. These levels represent areas on the chart where price has previously reacted, and the probability of a similar reaction in the future is considered high.
Definition of Support and Resistance Levels
A support level refers to an area where the price, during a decline, has previously stopped or reversed. This level is usually caused by increased demand and the entry of buyers into the market. Conversely, a resistance level is an area where the price, during an increase, faces selling pressure and is likely to reverse. These psychological and historical levels are significant in market analysis due to repeated trader reactions.
Application of Support and Resistance in Setting Take Profit
One common method for setting Take Profit is using these technical levels. In buy trades, traders typically set the Take Profit slightly below the resistance level, as the price may encounter supply and reverse upon reaching this area. In sell trades, the Take Profit is usually set slightly above the support level because this area can lead to the entry of buyers and a potential price reversal.
Importance of Price Position Relative to Market Structure
For effective use of support and resistance levels, attention to the overall market structure is essential. In trending markets, support and resistance levels are frequently broken and turn into each other. However, in ranging or trendless markets, these levels are often repeatedly tested. In such conditions, traders can more accurately place their Take Profit at the edges of the horizontal channel and benefit from short term fluctuations.
Combining with Other Technical Tools
To increase the accuracy of setting Take Profit, support and resistance levels can be combined with other tools such as moving averages, trend lines, or indicators like RSI and MACD. This combination can create significant intersection points where the probability of a price reaction is higher, making the trader more confident in selecting the Take Profit level.
Impact of Timeframe on the Accuracy of Levels
Support and resistance levels drawn on higher time frames such as daily or weekly charts are more reliable and are better suited for mid term and long term trades. In contrast, for short term or scalping trades, using support and resistance levels on lower time frames like 5 minute or 15 minute charts is more logical. In any case, correctly identifying these levels and aligning them with the trader’s trading style is essential for effectively utilizing them in setting Take Profit.
Using Fibonacci Tools and Channels to Set Take Profit
For a professional trader, setting a Take Profit does not mean finding an area where there is merely "hope for profit," but rather an area where, based on price behavior and market structure, a meaningful reaction is likely. One of the most accurate and technical ways to reach such areas is by using tools like Fibonacci and price channels. These tools, by providing potential price reversal levels, are highly reliable for determining exit areas.
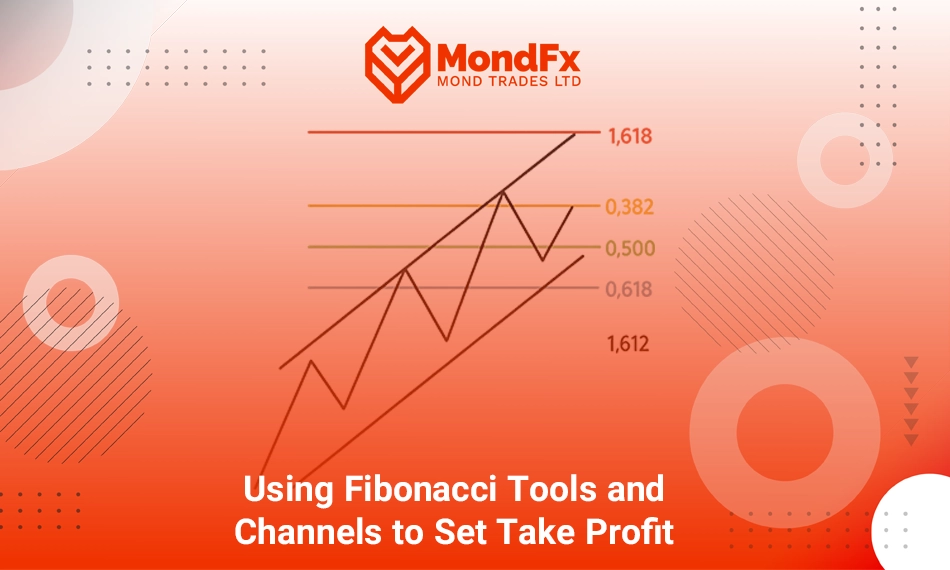
The Philosophy of Using Fibonacci for Take Profit
The Fibonacci tool is not a magical predictor but a logical framework that, based on mathematical ratios derived from the Fibonacci sequence, identifies potential price reaction points. In professional trading, extension levels such as 1.27, 1.618, or even 2.618 are more often used for setting Take Profit than retracement levels. When the market makes a major move and enters a correction, these levels can be used to identify potential points for the end of the correction or continuation of the trend for exit purposes. In other words, instead of exiting in the dark, we exit in areas where other traders are also likely to react.
Application of Fibonacci Retracement and Extension Combined with Market Structure
When using Fibonacci, the alignment of its levels with highs, lows, supply and demand areas, and even key candlesticks is important. For example, if the 1.618 Fibonacci extension level precisely coincides with a static resistance or a previous reaction zone in the market, this point can be a valid and probable target for Take Profit. In this case, we have confirmation not only from Fibonacci’s numerical logic but also from price action and crowd behavior.
The Role of Price Channels in Identifying Exit Areas
Price channels are another favorite tool of professional traders for determining profit zones. When the price moves within a channel like structure, the tops and bottoms of these channels effectively become decision making areas. If you have entered a buy trade at the bottom of a descending channel, the top of the channel can be your main Take Profit. Conversely, if you have entered a sell trade from the bottom of an ascending channel, the bottom of the channel can serve as a safe and intelligent exit.
The Structure of Trending Markets and the Importance of Channel Alignment with the Trend
In trending markets, the price usually oscillates within channels with a defined angle. Precisely drawing these channels, with a proper understanding of the starting point, trend slope, and validity of price touches, can be one of the best tools for predicting the continuation of the price path. The use of channels becomes even more valuable when the price approaches the channel boundaries and signs of divergence or trend weakness appear. In such conditions, exiting within the channel range is not only logical but also somewhat conservative and smart.
Professional Conclusion
If I were to share my personal experience with you, setting a Take Profit without using precise technical levels like Fibonacci and channels is like driving in fog. Tools like these not only provide you with a precise view of the probable future price but also help you avoid turning good entries into bad exits. In the end, it does not matter where you entered; what matters is where you exit. And for a professional trader, exiting the market is not about where the price stops; it is about where you decide to stop, based on market logic, not personal emotions.
Analyzing Candlestick Structure and Market Timing in Setting Take Profit
In the real world of trading, merely having a numerical Take Profit or a technical level is not enough. Professionals know that the market is a living entity influenced by the pulse of order flow, collective psychology, and temporal rhythm. Analyzing candlestick structure and market timing are two crucial elements for interpreting price behavior and deciding when to close a trade. If properly understood, these two can alone tell you whether it is time to exit or if there is still potential for trend continuation.
Strength or Weakness of Candles: Vital Exit Signals
The structure of candles provides precise information about market behavior. For instance, if you are in a buy trade and, after several strong bullish candles, the market starts printing candles with small bodies and long upper wicks, it means buyers are retreating and sellers are stepping in. Such a signal should not be ignored; it can be an indication to exit with profit before the market turns against you.
On the other hand, if you are in a sell trade and suddenly see high volume candles with long bodies closing near the daily low, the probability of an accelerated downward trend increases. However, if these candles appear weak, with long wicks and without decisively breaking supports, it could be a warning for a price correction or reversal.
Alignment of Timeframe with Trade Objective
One of the common mistakes among novice traders is the improper use of timeframes. If you have entered a trade on the 15 minute timeframe, you should not set your target based on the structure of daily time frame candles, as reaching such a target is either very unlikely or time consuming. Setting a Take Profit target must be aligned with the nature of the entry time frame. A professional trader always creates a balance between the timeframe, the volatility range, and the price objective.
Impact of Economic Events and Market Openings
Markets always react to news, but the important point is when these reactions occur. If you are trading in a market like Forex, the release of major economic data such as interest rates, employment reports, or inflation figures can completely alter the price movement structure. Therefore, if your Take Profit is set close to the time of a major event, you must either accept the risk of a sharp price reversal or close the trade before the news release.
Moreover, the opening of global markets like London or New York can shift the market's volume and direction. An experienced trader, by understanding the daily market cycles, knows that each time of day has its own characteristics and bases the decision to close a trade on these features.
Candlestick structure and market timing are more than just technical tools; they are the language of the market. If you can read this language, you will realize when the market is aligned with you and when it is ready to turn. Exiting a trade is only successful when it aligns with the psychological and temporal flow of the market. Professionals do not merely focus on static targets; they pay attention to the market’s living dynamics, and this is precisely where their decision making sets them apart from others.
Trailing Take Profit and Partial Exit
In many advanced trading strategies, instead of using a fixed Take Profit, dynamic methods such as a Trailing Take Profit are employed. In this approach, the trade is allowed to produce greater profits if the trend continues, while simultaneously protecting a portion of the earned gains. This technique is especially useful in markets with strong trends and prevents the trader from being caught off guard by sudden market reversals.
The Concept of Trailing Take Profit
Trailing Take Profit works by gradually and automatically adjusting the exit level as the price moves favorably. In other words, if the market moves toward the trade's target, the Take Profit is also adjusted in such a way that, in case of a price reversal, the trade closes with some profit. This helps preserve a significant portion of the gains, particularly under conditions where rapid fluctuations and price corrections are likely.
Partial Exit and Gradual Profit Locking
In the partial exit method, the trader does not close the entire position at one point but instead divides it into several parts and exits at different price levels. These levels are usually determined based on resistances, Fibonacci levels, or the market’s price structure. Stage by stage exit allows some profits to be locked in while still taking advantage of the continuation of the trend. This method reduces the risk of a complete price reversal and provides greater flexibility in position management.
The Importance of Alignment with Market Structure
Proper execution of trailing Take Profit or partial exit requires a deep understanding of market behavior, trend strength, and the overall price structure. In highly volatile markets, setting an inappropriate trailing distance may cause the position to close prematurely. On the other hand, if the partial exit levels are not correctly determined, part of the profit may be lost, or a portion of the position may remain at a level prone to price reversal. Thus, selecting exit points must be accompanied by precise technical analysis, attention to candlestick formation, and the current market trend.
The Role of Emotions in Setting Take Profit
One of the hidden but highly influential factors in a trader’s success is emotional control when setting Take Profit. Traders who fall into greed often set unrealistically high Take Profits, resulting in either never reaching the target or the market reversing before achievement. Conversely, some traders exit too early out of fear of losing gains, thereby missing out on a large portion of the potential profit. Having a predefined plan and adhering to it is an effective way to manage emotions.
Adapting Take Profit to Trading Personality
In financial markets, no single strategy fits all traders. One of the key factors in trading success is adapting tools and decisions to each trader’s personal style and mindset. Take Profit is no exception and must be aligned with the trader’s trading personality and time horizon. Without such alignment, even the most precise analyses may not yield desirable results in practice.
The Importance of Understanding Trading Personality
Each individual's trading personality includes their level of risk tolerance, the amount of time available for market monitoring, their tolerance for volatility, and psychological preferences regarding the type of trades. Some traders prefer to conclude their trades within a short period, while others focus on medium or long term movements. In this context, setting a Take Profit must align with these differences, not conflict with them.
The Role of Trading Style in Structuring Take Profit
Scalpers, who execute their trades within very short timeframes, usually deal with rapid market fluctuations and seek small but frequent profits. In this style, setting overly ambitious Take Profits is not only impractical but may also result in missed timely exit opportunities. Conversely, swing traders, who base their trades on larger price movements and operate on higher time frames, require broader profit targets and must have the ability to tolerate temporary market fluctuations to reach their final Take Profit.
Aligning Take Profit with Mental and Psychological Structure
Some traders prefer to exit trades quickly to endure less psychological pressure. These individuals are usually more comfortable with conservative Take Profit targets. On the other hand, those who have higher mental capacity for holding positions can set longer term targets and benefit more from major market moves. This shows that even if two people enter the market with the same strategy, their method of exit can be entirely different because psychological parameters play a decisive role in decision making.
How to Set a Stop Loss?
Setting a Stop Loss is one of the main pillars of risk management in financial market trading. Without using a Stop Loss, even the best analyses and strategies may lead to irreparable losses with an unexpected fluctuation. In fact, a Stop Loss is a tool for protecting capital and controlling potential losses; a tool whose proper use requires a thorough understanding of market structure, trend strength, and price behavior.
Choosing a Logical Location for Stop Loss
Stop Loss should not be set based on guesswork or emotions but must be supported by structural logic and technical analysis. The placement of the Stop Loss should be at a level where, if the price reaches it, it becomes clear that the analyzed scenario is no longer valid. This area could be below a strong support level in buy trades or above a significant resistance in sell trades. Moreover, in some strategies such as price action, the low or high of the last valid candlesticks is also considered as a Stop Loss area.
The Relationship Between Stop Loss, Timeframe, and Strategy Type
In lower time frames where volatility is higher, Stops are usually set closer and with lower volumes because rapid market movements can easily trigger wide Stops. Conversely, in higher time frames where movements are slower but deeper, there is more room for the position to breathe, and Stops are set at a more reasonable distance. Therefore, the type of strategy, trading timeframe, and even the trader’s personality play a role in determining the appropriate Stop Loss distance.
Numerical or Structural Stop Loss?
In some cases, novice traders prefer to set their Stop Loss based on a fixed amount of pips or percentage. Although this method is understandable from a capital management perspective, it often does not align with the actual market structure. Professionals usually set their Stop Loss based on chart structure, breakout zones, key levels, or current market volatility. This approach allows greater flexibility and coordination with market reality and prevents premature or improper exits.
Using Higher Timeframe Moving Averages to Set Take Profit
In technical analysis, one effective method for understanding the direction and strength of a trend is the use of moving averages. By eliminating price noise and displaying the market's medium term trajectory, this tool helps traders make more accurate decisions about when to exit a trade. When a moving average from a higher time frame compared to the entry time frame is used, it can serve as a logical target for Take Profit and increase the likelihood of a price reaction in that area.
In many trend following strategies, price movement toward a higher timeframe moving average is considered a retracement or corrective phase. For example, if a trader enters a buy position on the 15 minute timeframe, they can consider one of the hourly moving averages such as the 50 EMA or 100 SMA as an exit point. These levels usually act as dynamic support or resistance in trending markets and can be suitable areas for locking in profits.
Combining this method with other technical tools such as Fibonacci levels, candlestick structure, and supply and demand zones increases the accuracy of exits. Attention to the slope and angle of the moving average is also important. When the moving average has a clear upward or downward slope, the probability of price reaction to it is higher. Conversely, when the moving average is flat or lacks a distinct slope, its role as a target level may be weakened.
Ultimately, using higher timeframe moving averages is a method that leverages the multi dimensional logic of technical analysis. With this approach, the trader does not merely rely on the information from the entry time frame but evaluates the overall market direction from a broader perspective and plans a smarter exit.
What Is a Trailing Stop Loss and How Does It Work?
A Trailing Stop Loss is considered one of the important tools in advanced risk management. Unlike a fixed Stop Loss, which remains at a specific price level, the Trailing Stop Loss moves gradually with the price in the trader’s favor and closes the trade at a point with either a profit or a smaller loss if the price reverses. This tool is particularly effective in trending or volatile markets and helps the trader protect profits while staying engaged with the trend.
How a Trailing Stop Loss Works
In this method, a distance from the market price is set as the Stop Loss, and as the price moves in favor of the trade, the Stop Loss moves proportionally at the same distance. However, if the price reverses, the Stop Loss does not move back, and if the price reaches it, the trade is closed. For example, if a trader is in a buy position and sets the Trailing Stop Loss 20 pips below the price, with every 10 pips increase in price, the Stop Loss moves up by 10 pips. But if the price retraces and the gap with the Stop Loss becomes 20 pips, the trade is closed.
Advantages of Using a Trailing Stop Loss
The main application of a Trailing Stop Loss is to preserve part of the profits earned in trending markets. This type of Stop Loss allows the trader to capitalize more effectively on strong market movements without having to manually adjust the exit level. Additionally, using this method reduces emotional decision making since exits are based on systematic logic rather than impulsive reactions.
Key Points for Implementing a Trailing Stop Loss
Setting the appropriate distance for a Trailing Stop Loss is crucial. If the distance is too small, it may be triggered prematurely by normal market fluctuations, eliminating the opportunity for further profit. On the other hand, if the distance is set too large, its function will resemble that of a fixed Stop Loss and it will lose its main advantage of dynamic profit protection. Choosing this distance should be based on market volatility, trading timeframe, and the price structure of the asset.