The Morning Star candlestick pattern is a bullish reversal pattern in technical analysis that traders use to identify points where a downward trend is likely to reverse into an upward trend. This pattern appears at the end of a downtrend and indicates a shift in market sentiment from bearish to bullish.
Concept of the Morning Star Pattern in Technical Analysis
The Morning Star pattern is recognized as a reversal pattern consisting of three consecutive candlesticks. These candlesticks signal a gradual shift in control from sellers to buyers, providing traders with a bullish signal.
Characteristics of the Morning Star Pattern
Each candlestick in this pattern has specific characteristics that make it easier to identify. The first candlestick is a long red bearish candle, which indicates strong selling pressure in the market. This candle typically appears at the end of a downtrend.
The second candlestick is a small bodied candle that can be either bullish or bearish. This candle generally has a small body with long wicks on either side. Due to its position on the chart, this candle is referred to as the "star" and represents reduced selling pressure and the potential entry of buyers.
The third candlestick is a strong green bullish candle that usually opens within the body of the first candle and closes above its midpoint. This candle signifies that buyers have gained control over the market, initiating an upward trend.
Conditions for Confirming the Morning Star Pattern
To consider the Morning Star pattern a valid signal, several key conditions must be met.
The first condition is the presence of a clear and defined downtrend before the pattern forms. This downtrend confirms that the market has been under heavy selling pressure, increasing the likelihood of a trend reversal to bullish.
The second condition concerns the third candlestick. This candle must be a strong bullish candle that closes completely above the midpoint of the first candle. This confirms that buyers have entered the market with strength and have taken control of the trend.
The third important condition for confirming this pattern is an increase in trading volume during the third candlestick. A noticeable rise in volume at this stage is a strong indication that buyers are entering the market, and market sentiment is shifting from bearish to bullish. This volume increase confirms that the price rise is supported by strong momentum, making a continued upward trend more likely.
By observing these conditions, traders can gain greater confidence in the validity of the Morning Star pattern and make more informed decisions when entering trades.
Signs of the Evening Star Pattern
The Evening Star pattern is a bearish reversal pattern that appears at the end of an uptrend, indicating a potential shift in market direction towards a downtrend. To correctly identify this pattern, traders should look for several key signs:
1) Uptrend Before the Pattern Formation:
The first important sign for identifying the Evening Star pattern is the presence of a strong uptrend before the pattern appears. This uptrend suggests that the market is in a bullish phase with strong buyer dominance, but signals a potential weakening of their strength.
2) First Candle (Strong Bullish Candle):
The first candle in this pattern should be a strong green bullish candle with a large body, indicating continued buyer dominance.
3) Second Candle (Star Candle):
The second candle is typically a small bodied candle that can be either bullish or bearish. This candle opens above the first candle's closing price, often creating a price gap (Gap)between the two candles. This small candle indicates weakening buyer strength and increasing uncertainty in the market.
4) Third Candle (Strong Bearish Candle): The third candle must be a strong red bearish candle that closes below the midpoint of the first candle. This candle confirms the beginning of a bearish trend and signals a shift in market sentiment.
5) Decreasing Volume on the Second Candle and Increasing Volume on the Third Candle:
In most cases, the second candle is accompanied by reduced trading volume, indicating hesitation among buyers about continuing the uptrend. Conversely, in the third candle where selling pressure rises trading volume typically increases significantly, serving as a final confirmation of the trend reversal.
6) Confirmation with Indicators:
Combining this pattern with indicators like RSI (entering the overbought zone and declining) and MACD (bearish crossover) can provide a stronger signal of a market reversal toward a downtrend.
Differences Between the Morning Star and Evening Star Patterns
The Morning Star and Evening Star patterns are both reversal patterns in technical analysis, but they differ significantly in their structure, interpretation, and trading signals. The following outlines their key differences:
Difference in Nature
The Morning Star pattern is a bullish reversal pattern that forms at the end of a downtrend. It signals the exhaustion of selling pressure and the beginning of a bullish trend. In contrast, the Evening Starpattern is a bearish reversal pattern that appears at the end of an uptrend and signals the onset of a bearish trend.
Difference in Candle Structure
In the Morning Star pattern, the first candle is a large red bearish candle that reflects strong selling pressure. The second candle is a small and neutral candle that indicates market hesitation. Finally, the third candle is a strong green bullish candle that closes above the midpoint of the first candle, confirming the transition from bearish to bullish sentiment.
In contrast, the Evening Star pattern begins with a strong green bullish candle, representing continued buyer dominance. The second candle is small and neutral, showing hesitation and indecision in the market. The third candle is a powerful red bearish candle that closes below the midpoint of the first candle, confirming the beginning of a bearish trend.
Difference in Preceding Trend
The Morning Star pattern appears at the end of adown trend, signaling a potential bullish reversal. Conversely, the Evening Star pattern forms at the end of an uptrend, indicating the start of a bearish reversal.
Difference in Trading Volume
In the Morning Star pattern, increasing volume during the third candle is a strong sign of buyer entry and a bullish trend initiation. Conversely, in the Evening Star pattern, rising volume during the third candle reflects heightened selling pressure and strengthens the bearish reversal signal.
How to Trade Using the Morning Star Pattern
Trading with the Morning Star pattern requires precision through several key steps to ensure optimal use of this pattern. Below are the steps for executing a successful trade based on the Morning Star pattern.
Entering the Trade
The first step is to wait for full confirmation of the pattern. You should wait until the third candle is fully formed and closed. The closing of the third candle above the midpoint of the first candle confirms that the downtrend has ended and an upward trend has started. At this stage, you can enter a buy position with greater confidence.
Setting the Stop Loss
After entering the trade, determining the stop loss is a crucial step for risk management. The best position to place the stop loss is at the lowest point of the second candle or at the low of the first candle. This area acts as a strong support level, and if it is broken, the likelihood of the downtrend continuing increases.
Setting the Take Profit
To determine the take profit level, traders can use technical analysis tools such as Fibonacci retracement levels or previous resistance points. These levels are often areas where selling pressure has increased in the past, causing the price to fall. Placing the take profit near these levels allows you to secure profits at the most optimal point and avoid potential price reversals.
Best Timeframe for Identifying the Morning Star Pattern
The Morning Star pattern is more reliable in longer timeframes such as the daily (D1) and weekly (W1)charts. In shorter timeframes, the pattern may produce more false signals due to market noise and volatility.
Supporting Indicators for Confirming the Morning Star Pattern
To improve accuracy in identifying and confirming the Morning Star pattern, the use of complementary indicators can help traders receive stronger and more reliable signals. Below are three important indicators that can effectively confirm this pattern.
1.RSI Indicator (Relative Strength Index)
The RSI indicator measures the strength of buying and selling pressure in the market. When the Morning Star pattern forms, if the RSI is in the oversold zone (below the 30 level) and then starts to rise, this is a strong indication that selling pressure is weakening and buyers are gaining strength. The RSI exiting the oversold area is usually a solid confirmation of the beginning of an upward trend.
2. MACD Indicator (Moving Average Convergence Divergence)
TheMACD indicatoris one of the most powerful tools for identifying trend changes. During the formation of the Morning Star pattern, if abullish crossoveroccurs in the MACD (where the MACD line crosses above the signal line), this is a strong signal that a bullish trend is beginning. A bullish crossover in the MACD strongly confirms the shift from a downtrend to an uptrend and also reinforces the reliability of the Morning Star pattern.
3. Trading Volume
increase in trading volume in the third candle of the Morning Star pattern is a key indication that buyers are entering the market. This rise in volume confirms that the new bullish movement has sufficient strength and that the upward trend is likely to continue. Higher volume during the third candle is generally accompanied by stronger trader confidence in the trend reversal.
By combining these key indicators with the Morning Star pattern, traders can increase their accuracy in identifying strong buy signals and minimize the risk of false breakouts.
Common Mistakes in Identifying the Morning Star Pattern
During the process of identifying theMorning Star pattern, traders may make certain mistakes that can lead to poor decisions and financial losses. Below are the most common mistakes in identifying this pattern and ways to avoid them.
One of the most common mistakes isentering a trade prematurely before the third candle has closed. Many traders, upon seeing the second candle which is usually small and neutral mistakenly believe the pattern has been confirmed and enter the trade too early. However, the final confirmation of this pattern occursonly after the third candle has fully closedand positioned itself appropriately relative to the first candle. Entering a trade before this stage can carry significant risk.
Another common mistake isfailing to identify a prior downtrendbefore the pattern appears. The Morning Star pattern is only valid when it appearsat the end of a clear downtrend. If this pattern emerges inrange bound markets(sideways movement) ormidway through an uptrend, the signal is less reliable. Therefore, examining the overall market structure and confirming the presence of a preceding downtrend is crucial before relying on the Morning Star pattern.Ignoring trading volumeis another key mistake in identifying the Morning Star pattern. A significant increase in volume during the third candle is usually a strong confirmation of buyer entry and a shift in market sentiment. If trading volume does not noticeably increase during the formation of the third candle, the likelihood of the downtrend continuing remains high, and the received signal may be misleading.
To improve accuracy in identifying the Morning Star pattern, traders should:Wait for the third candle to closefor confirmation.
Ensure there is a clear preceding downtrendbefore the pattern appears.
Consider trading volumeas a key confirmation signal.
Following these steps can help reduce trading risks and improve the success rate when using the Morning Star pattern.
Application of the Morning Star Pattern in Financial Markets
The Morning Star pattern is one of the powerful reversal patterns in technical analysis that can be effectively used across various financial markets. This pattern performs well in markets such asForex,stocks,cryptocurrencies, andcommodities.
Reliability of the Morning Star Pattern in Different Markets

Although the Morning Star pattern can be identified in all financial markets, its reliability is higher in markets with greater liquidity. Highly liquid markets, such as Forex and major stock indices, exhibit smoother price movements, making the signals provided by this pattern more accurate.
In contrast, in markets with lower liquidity, such as certain low cap altcoins or infrequently traded stocks, the Morning Star pattern may produce more false signals due to extreme volatility and irregular price behavior. In such conditions, traders are advised to combine this pattern with technical indicators and volume analysis to reduce risk and improve accuracy.
Combining the Morning Star Pattern with Other Technical Patterns
Combining the Morning Star pattern with other reversal patterns can enhance trading accuracy and increase the likelihood of successful trades.
Combination with the Hammer Pattern
The Hammer pattern is a bullish reversal pattern that typically appears at the end of downtrends. When the Hammer pattern forms near the Morning Star pattern, it can provide strong confirmation of a market reversal and increased buyer strength.
Combination with the Bullish Engulfing Pattern
TheBullish Engulfing patternis another powerful reversal pattern that can effectively complement the Morning Star pattern. In this pattern, a small bearish candle is completely engulfed by a large bullish candle. When this pattern occurs alongside the Morning Star pattern, the likelihood of an upward trend starting increases significantly.
When Does the Morning Star Pattern Occur?
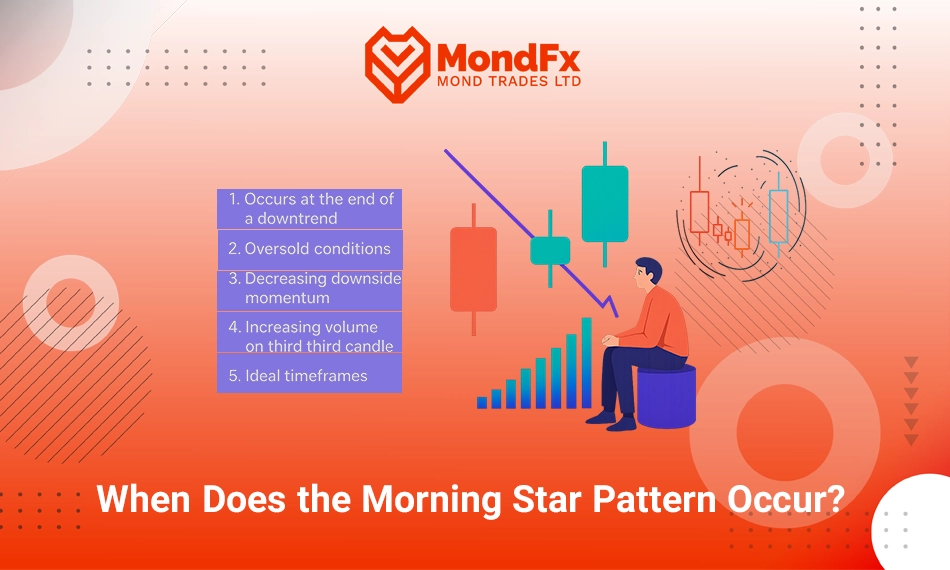
TheMorning Star patterntypically appears under specific market conditions that indicate a shift in investor sentiment and the beginning of a bullish trend. The following points explain these conditions in detail:
1. Occurrence at the End of a Downtrend
The Morning Star pattern appears at the end of adowntrend. At this stage, the market is under heavy selling pressure, and prices are continuously declining. This downtrend is usually accompanied by large bearish candles, signaling strong dominance by sellers.
2. Oversold Conditions
This pattern often occurs when the market has enteredoversold territory. In this condition, many sellers have exited the market, and downward momentum is weakening. Indicators such as theRSIare usually below the30 level, which signals oversold conditions.
3. Decreasing Bearish Momentum
One of the early signs of the Morning Star pattern is the gradual reduction of bearish momentum. At this stage, the second candle, typically a small bodied candle, appears. This small candle indicates market uncertainty and weakening selling pressure.
4. Increasing Volume in the Third Candle
In the final stage, the third candle, which is a strong bullish candle, is often accompanied by increased trading volume. This volume increase confirms that buyers have entered the market with strength, increasing the likelihood of an upward trend continuation.
5. Ideal Timeframes
The Morning Star pattern is more reliable in longer timeframes such as thedaily (D1)andweekly (W1)charts. In these timeframes, false signals are less frequent, and changes in market sentiment are more evident.
TheMorning Star patterntypically appears at the end of adowntrendand under conditions where the market is inoversold territory. Reduced selling pressure, the formation of a small bodied candle, and increased volume in the third candle are crucial signs that confirm this pattern. Accurately identifying the timing of this pattern can help traders spot ideal buying opportunities and minimize trading risks.
How to Identify the Morning Star Pattern in a Chart
To correctly identify theMorning Star patternin price charts, paying attention to a few key points is essential:
First, it is important to confirm the presence of aclear downtrendbefore the pattern appears. This downtrend is usually characterized by large red bearish candles and strong selling pressure.
Next, the formation of asmall candle(either bullish or bearish) with a noticeable gap from the first candle is crucial. This small candle, known as the "star," signals adecrease in selling pressureand the gradual entry of buyers. The position of this candle relative to the first candle is highly important, and it is typically seen with aprice gapopening at a lower level than the closing price of the first candle.
The third step involves identifying astrong bullish candlethat closes above the midpoint of the first candle. This candle acts as the final confirmation of the trend reversal and signals increased buying strength.
Finally, observing anincrease in trading volumein the third candle can provide even stronger confirmation of this pattern's validity. Rising volume indicates that the upward price movement is supported by sufficient strength.
To reduce risk and improve accuracy in identification, combining this pattern with confirmation tools such asRSI(indicating a move out of the oversold zone) orMACD(bullish crossover) is recommended.
Focusing on these practical points and utilizing longer timeframes can significantly improve the chances of successful trades based on the Morning Star pattern.
Trading Strategy Using the Morning Star Pattern
For a successful trade using the Morning Star pattern, you should firstwait for the third candle to closecompletely. Entering the trade should occur around the closing price of this candle or at thefirst bullish candlethat follows.
Place yourstop lossat thelowest point of the second candleor at thelow of the first candle. This level serves as a key support point, and if it is broken, the likelihood of the market resuming a bearish trend increases.
To set yourtake profit, you can useprevious resistance levelsor tools likeFibonacci retracement. It is recommended that your take profit level is at leasttwice the size of your riskto maintain a favorable risk to reward ratio.
For additional confirmation, combining this pattern with indicators likeRSI(moving out of the oversold zone) andMACD(bullish crossover) can further improve the chances of a successful trade.
By focusing on these simple and practical steps, you can enter trades with greater confidence using the Morning Star pattern while effectively managing potential risks.