Before the release of the NFP report, before the CPI print impacts the markets, professional analysts have one specific question: What phase is the U.S. economy exactly in? The reality is that making definitive forecasts of economic data without access to the raw data of the U.S. Department of Labor (BLS) is practically impossible. However, financial markets are not blind. There are indicators that signal shifts in the economic cycle ahead of official data releases; the PMI index is one of the most important among them. PMI is not intended to predict the exact NFP figure, nor to replace CPI. But if interpreted correctly, it can provide a relatively accurate picture of the trajectory of inflation, employment, and economic growth several weeks ahead of the broader market.
Author: Sajjad Sheikhi
Before the release of the NFP report, before the CPI print impacts the markets, professional analysts have one specific question:
What phase is the U.S. economy exactly in?
The reality is that making definitive forecasts of economic data without access to the raw data of the U.S. Department of Labor (BLS) is practically impossible. However, financial markets are not blind. There are indicators that signal shifts in the economic cycle ahead of official data releases; the PMI index is one of the most important among them.
PMI is not intended to predict the exact NFP figure, nor to replace CPI. But if interpreted correctly, it can provide a relatively accurate picture of the trajectory of inflation, employment, and economic growth several weeks ahead of the broader market.
What Is the PMI Index and Why Does the Market Pay Attention to It?
The PMI (Purchasing Managers’ Index) is derived from a monthly survey of corporate purchasing managers individuals whose decisions are directly tied to production, orders, hiring, and pricing.
In this survey, purchasing managers respond to variables that form the backbone of the real economy, including:
Changes in new order volumes
Employment conditions and workforce reductions
Fluctuations in raw material prices
Inventory levels
Supplier delivery times
These responses are ultimately converted into a number between 0 and 100. The interpretation of this figure is straightforward yet highly practical:
Above 50: Economic activity is expanding
Below 50: The economy has entered a contraction phase
PMI is typically released separately for the manufacturing and services sectors. Given that more than 70% of the U.S. economy is service based, the Services PMI is often considered a more reliable signal for assessing macroeconomic conditions.
When PMI Falls, How Severe Is the Economic Deterioration?
One common mistake in analyzing PMI is the assumption that only extremely low readings such as figures close to zero signal a crisis. Historical evidence suggests otherwise.
During periods such as the deep European recession in 2024, PMI in many countries dropped below 40 a level that clearly reflected intense recessionary pressure. Therefore, in identifying recession or recovery, the trajectory of the index and the duration of its stay within certain ranges matter more than the absolute number itself.
If PMI remains below 50 for several consecutive months, even without reaching extremely low levels, it is reasonable to speak of sustained economic weakness.
Who Publishes the PMI and Which Report Is More Important?
In the United States, there are two primary PMI sources, both of which are important for analysts:
PMI by S&P Global
This institution publishes economic and financial data on a global scale, providing a broad picture of economic conditions. S&P Global’s reports are particularly useful for international comparisons.
PMI by Institute for Supply Management (ISM)
The ISM is the oldest PMI publishing authority in the United States, and due to its long track record and rigorous methodology, its report carries the greatest weight in Federal Reserve decision making. For this reason, market reactions to the ISM PMI are typically stronger.
Why Is the Headline PMI Number Not Sufficient?
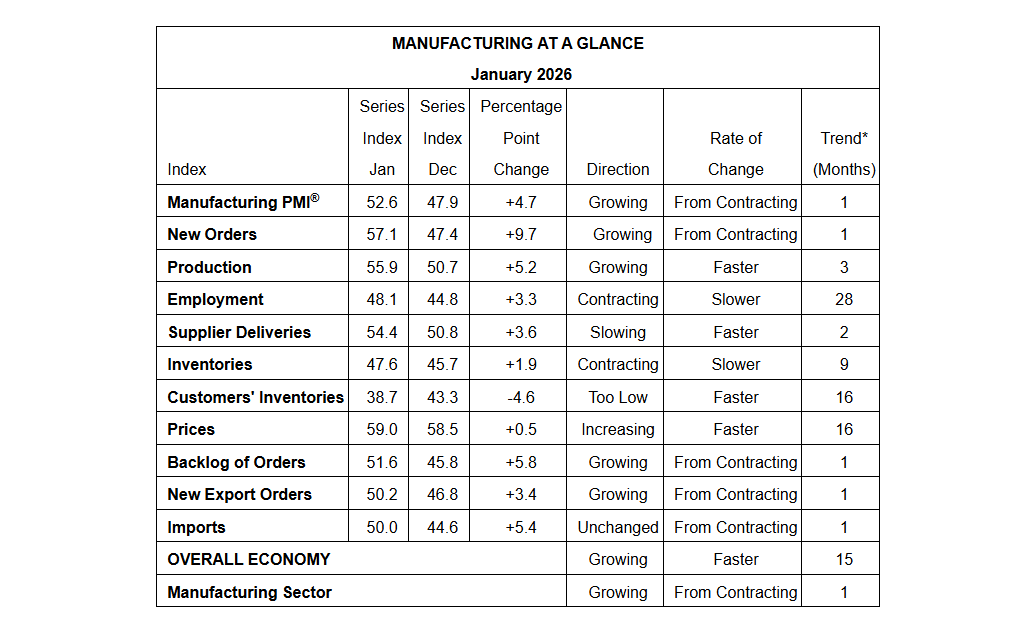
A superficial analysis of PMI typically focuses only on the headline figure, whereas professional analysis begins with the report’s underlying details.
Two sub indices carry the greatest importance:
Employment Index
Input Prices Index
These two components are directly linked to the primary objectives of monetary policy namely, controlling inflation and maintaining labor market stability. For example, if the Input Prices Index rises, there is a possibility that this pressure will be transmitted to consumer prices in the coming months.
Likewise, a gradual improvement in the Employment Index even if it remains below 50 may signal a reduction in recessionary pressure, not necessarily a full recovery of the labor market.
What Is the Relationship Between PMI, NFP, and CPI?
One of the most important advantages of PMI is its release timing. This index is published before data such as NFP and CPI, which makes it a forward looking tool.
However, one key point must be emphasized:
PMI is not designed to predict the exact NFP figure. PMI merely indicates the general direction of the economy, whereas NFP reports the numerical change in employment.
For this reason, professional analysts place PMI alongside other data points and build scenarios, rather than making definitive forecasts based solely on it.
The Real Voice of the Economy: Purchasing Managers’ Commentary
The qualitative section of the PMI report namely, the comments from purchasing managers is one of the most valuable parts of this data. In this section, managers discuss real business challenges issues that are often not yet reflected in official statistics.
Topics such as:
Uncertainty surrounding tariff policies
Rising costs and pressure on profit margins
Postponement of investment plans
Concerns over weakening consumer demand
These remarks often serve as early inflationary or recessionary warnings that may become visible several months later in CPI or NFP data.
Why Do Manufacturing and Services PMI Sometimes Diverge?
In PMI reports, divergence is sometimes observed between manufacturing and services; that is, the services sector may be experiencing expansion and growth, while the manufacturing sector is caught in contraction. The opposite scenario manufacturing expansion alongside services contraction is theoretically possible as well. However, in practice, when divergence between manufacturing and services is discussed, it is most often the former situation that occurs.
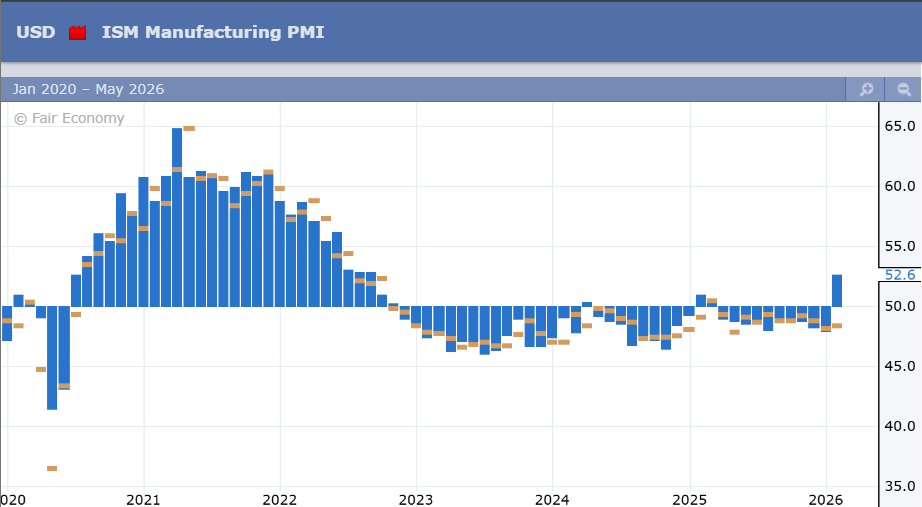
For example, the above image illustrates the prolonged contraction in the U.S. manufacturing sector.
But what explains this development? This divergence is related to the nature and operating structure of manufacturing and services companies.
Strengthening of the domestic currency:When a country’s currency appreciates, exporting goods becomes more difficult for manufacturers; due to the stronger domestic currency, goods become more expensive for foreign buyers. Under such conditions, exports decline and the manufacturing sector is adversely affected, whereas the services sector is typically less impacted.
The efficiency gains from artificial intelligence in production processes:The second reason is the efficiency impact of artificial intelligence. In the services sector, AI has significantly increased productivity and, as a result, boosted output. However, in manufacturing, AI adoption is not yet widespread, and it may take several more years before substantial efficiency gains from AI are realized in that sector.
A Sample Fundamental Analysis Using PMI
The U.S. economy is primarily driven by the services sector, while the manufacturing sector has shown weaker performance. Supportive policies under the Donald Trump administration including the imposition of tariffs and the deliberate weakening of the dollar were implemented with the aim of revitalizing domestic production.
A recovery in manufacturing can strengthen U.S. GDP growth an issue that, following the end of interest rate cutting cycles, becomes a primary driver for financial markets.
This is where PMI becomes important:
If the Manufacturing PMI rises for several consecutive months and enters expansion territory, it can be concluded that the industrial sector is beginning to play a more prominent role in economic growth.
Conclusion: Why Should PMI Be Taken Seriously?
The PMI index is one of the most important forward looking tools for analyzing economic conditions, inflation, and employment. By examining the perspectives of purchasing managers, it provides a relatively accurate picture of the current state and future trajectory of the economy.
In the United States, the PMI published by the Institute for Supply Management (ISM) is recognized as the primary benchmark for the Federal Reserve. Analyzing the trend of this index and its underlying details helps foster a deeper understanding of monetary policy, inflationary pressures, labor market conditions, and the outlook for economic growth well before the release of key data such as NFP and CPI.