In financial markets, one of the most important analytical tools for predicting price movements is Price Action. This method is based on studying past price movements, enabling traders to identify entry and exit points in the market. Price action is a method of analyzing financial markets that focuses solely on price data and does not rely on indicators or additional tools. Price action traders believe that all the necessary information is embedded within the price chart itself, and indicators often provide delayed information. In this method, price movements, candlestick patterns, support and resistance levels, and market structure are the key elements for analysis.
Principles of Price Action
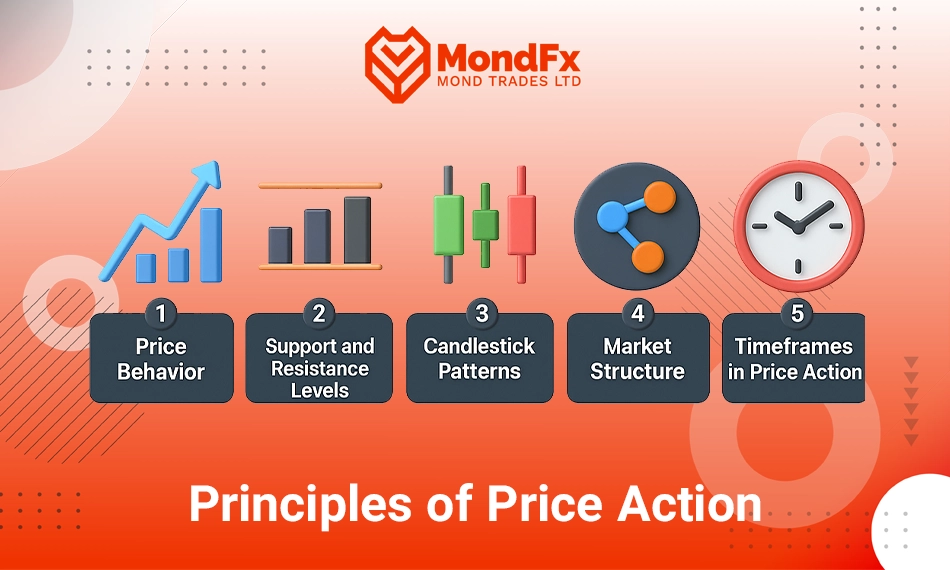
Price action is based on several key principles that are essential for successful trading. These principles include analyzing price behavior, identifying support and resistance levels, recognizing candlestick patterns, and understanding market structure. Each of these principles is explained in detail below.Price Behavior
Price behavior is the most important principle in price action. Traders analyze past price movements to predict future trends. This principle is based on market psychology, suggesting that price behavior reflects the decisions and emotions of buyers and sellers.
Price behavior creates recurring patterns that result from collective trader decisions. For example, in an uptrend, if the price suddenly drops after several positive candles, this behavior may indicate weakening buyers and a potential trend reversal. Understanding these movements helps price action traders identify optimal entry and exit points.Support and Resistance Levels
Price action traders typically identify support and resistance levels using the following indicators:
Areas where the price has previously reacted are often considered key support and resistance levels. These levels are usually strong reversal points.
Large candles that have suddenly reversed from a specific level indicate the strength of that level as support or resistance.
Zones where trading volume has significantly increased can also be considered key levels.
False breakouts, where the price temporarily crosses a level but then quickly reverses, indicate the strength of that level as support or resistance.
Role of Support and Resistance in Price Action
In the price action method, support and resistance levels are crucial for identifying trading opportunities. These levels can be utilized in the following ways:
If the price approaches a support level and reversal signs appear (such as a bullish pin bar), traders often enter buy trades.
If the price nears a resistance level and signs of buyer weakness appear (such as a bearish pin bar or engulfing pattern), traders usually enter sell trades.
When a support or resistance level is broken, traders enter a trade in the direction of the breakout after confirmation (such as a candle closing above resistance or below support).
Support and Resistance Role Reversal
In price action, one of the important features of support and resistance levels is their ability to switch roles. When a support level is broken, it often acts as resistance in the future. Similarly, if a resistance level is broken, it may act as support in the future.
This role reversal allows price action traders to identify more trading opportunities and enter the market with greater confidence.
Importance of Time Frames in Identifying Support and Resistance
Support and resistance levels in higher time frames are generally more reliable. For instance, a resistance level on the daily chart has a stronger influence compared to a resistance level on a 15-minute chart.
Professional price action traders often use multi-timeframe analysis to identify these levels more accurately.Candlestick Patterns
Candlestick patterns are one of the primary tools in price action that provide valuable insights into buyer and seller psychology. These patterns can indicate trend reversals or continuation of price movement.
The Pin Bar pattern is one of the most important price action patterns. This candle features a small body and a long wick, indicating a potential price reversal. Pin bars often form near support and resistance levels and are considered strong signals in price action trading.
The Engulfing pattern is another key formation where a large candle completely engulfs the previous candle. This pattern typically signals a strong trend reversal. Additionally, the Inside Bar pattern occurs when a second candle is entirely contained within the range of the previous candle and usually signals trend continuation or market uncertainty.Market Structure
Understanding market structure is one of the most important skills for price action traders. Market structure is generally divided into three categories: uptrend, downtrend, and range-bound market.
In uptrends, prices typically create higher highs and higher lows.
In downtrends, prices form lower highs and lower lows.
In range-bound markets, prices fluctuate within a defined range without a clear trend.
Price action traders typically enter trades in the direction of the prevailing trend. In range-bound markets, they tend to buy near support levels and sell near resistance levels.Timeframes in Price Action
Choosing the right timeframe significantly impacts a price action trader’s performance. Short-term traders usually prefer lower timeframes such as 5-minute or 15-minute charts. Conversely, medium-term traders typically analyze 1-hour or 4-hour charts. Long-term traders focus on daily or weekly charts.Multi-timeframe analysis is a key technique in price action that helps traders gain a comprehensive view of market trends and make more precise decisions.
Price action is based on well-defined principles such as price behavior, support and resistance levels, candlestick patterns, and market structure. A proper understanding of these principles helps traders conduct accurate analyses and make informed trading decisions. Mastery of these concepts, alongside risk management and consistent practice, can significantly enhance success in financial market trading.
Popular Strategies in Price Action
Price action, as one of the powerful analytical methods in financial markets, offers various strategies that professional traders use to identify entry and exit points. Some of the most popular price action strategies are explained below.Pin Bar
The pin bar is one of the most important price action patterns that typically appears at market reversal points. This pattern consists of a candlestick with a small body and a long wick. The long wick in this candle indicates the rejection of price from a key level and signals a potential price reversal.
The pin bar is stronger when it forms near support and resistance levels. For example, if a bullish pin bar with a long lower wick appears near a strong support level, this pattern usually signals increased demand and a potential price rise. Conversely, a bearish pin bar near resistance may signal a price decline.Engulfing
The engulfing pattern is another popular price action strategy that is based on candlestick formations. This pattern consists of two consecutive candles, where the second candle completely engulfs the previous candle.
A bullish engulfing pattern forms when a large bullish candle fully covers the previous bearish candle. This condition typically signals a trend reversal from bearish to bullish. Conversely, a bearish engulfing pattern occurs when a large bearish candle fully engulfs the previous bullish candle, often indicating a bearish trend reversal.
Traders often identify this pattern near support and resistance levels to increase the validity of the signal.Fake Breakout
The fake breakout strategy involves identifying false breakouts at key market levels. In this method, the price initially breaks a significant level (such as support or resistance) but quickly reverses and moves in the opposite direction.
Professional traders identify these conditions and enter trades in the opposite direction after the price reversal. Fake breakouts often occur when there is high liquidity in the market, and large market players create false breakouts to gather orders.Inside Bar
The inside bar pattern is a continuation or reversal pattern in price action. This pattern forms when a candle is completely contained within the range of the previous candle. The inside bar typically indicates low volatility and market uncertainty.
Price action traders use this pattern as a signal for a breakout in the direction of the previous trend. If an inside bar forms in an uptrend and the price eventually breaks above the mother candle’s high, the uptrend is likely to continue. Conversely, a break below the mother candle’s low in a downtrend signals a continuation of the bearish trend.
Price action strategies like pin bar, engulfing, fake breakout, and inside bar are among the popular methods used by professional traders. When applied correctly and alongside proper risk management, these strategies can provide powerful signals for trade entry and exit. Success in implementing these methods requires consistent practice, a solid understanding of market movements, and precise identification of key levels.
Advantages and Disadvantages of Price Action
Price action, as one of the popular methods in technical analysis, has its own advantages and disadvantages. Understanding these features helps traders make informed decisions in financial markets.Advantages of Price Action
Price action has several key benefits that make it an attractive method for both beginner and professional traders.
Simplicity: Price action does not require indicators or complex tools, and traders can make decisions solely by analyzing price behavior. This simplicity makes price action appealing to traders at all experience levels.
Flexibility: Price action can be applied in all financial markets, including Forex, stocks, and cryptocurrencies. This method is effective across various timeframes, from minute charts to weekly and monthly charts.
High Accuracy: Price action, by focusing on real price movements, provides more accurate signals than many indicators. This precision allows traders to select optimal entry and exit points.
Combination with Other Analytical Methods: Traders can combine price action with other tools such as indicators or Fibonacci levels to enhance their analysis.Disadvantages of Price Action
Despite its advantages, price action also has some challenges that traders should consider.
Reliance on Individual Skill: Success in price action requires mastering chart analysis and gaining a deep understanding of price behavior. Beginner traders may face difficulties in the initial stages.
Potential for Varied Interpretations: Since price action is subjective, two traders with different experiences may interpret the same chart differently. This may lead to varying trading decisions.
Requirement for Practice and Experience: Mastering price action strategies requires time, study, and consistent practice. Without sufficient practice, traders may struggle to identify patterns correctly.
Emotional Influence on Decision-Making: Since price action relies heavily on personal judgment without additional tools, traders may become overly influenced by emotions and make impulsive decisions.
Price action offers a simple, flexible, and precise method for analyzing financial markets. However, achieving success with this method requires practice, experience, and a deep understanding of market behavior. Traders should fully understand the pros and cons of this method to effectively improve their performance in financial markets.
Difference Between Price Action and Technical Analysis
Price action and technical analysis are both crucial tools for predicting market movements, but they differ significantly in their analysis approach and methods. Understanding these differences helps traders select the strategy that best suits their trading style.Analytical Approach in Price Action and Technical Analysis
Price action is based on directly analyzing price movements in the chart. In this method, traders observe real-time price changes and focus on raw market data such as the opening price (Open), closing price (Close), highest price (High), and lowest price (Low), without the need for additional tools.
Conversely, traditional technical analysis often relies on indicators, trendlines, chart patterns, and various tools like Fibonacci retracements, moving averages (MAs), and Bollinger Bands. These tools are used as supplementary indicators and often provide delayed information compared to actual price data.Comparison Table: Price Action vs. Technical Analysis
| Feature | Price Action | Technical Analysis |
|---|---|---|
| Analysis Method | Based on price behavior, candlestick patterns, and support/resistance levels | Based on indicators, trendlines, and supplementary tools |
| Complexity | Simple and direct, without requiring complex tools | More complex due to the need for combining multiple indicators and tools |
| Signal Timing | Faster and more immediate signals due to direct price analysis | Delayed signals due to reliance on indicators |
| Flexibility | Applicable in all markets and timeframes | Requires different settings for various markets and timeframes |
| Reliance on Experience | Requires experience and skill in identifying patterns and market behavior | Less reliance on personal interpretation with clearer indicator signals |
| Emotional Control | Decisions are strongly influenced by personal judgment and market psychology | Provides objective signals, reducing emotional influence |
| Performance in Volatile Markets | Performs well in volatile markets with price movement analysis | May experience delayed signals during volatile conditions |
Complexity
Price action adopts a simpler approach where traders focus solely on price movements and candlestick patterns. In this method, the focus is on analyzing support and resistance levels, market reversal points, and overall price structure.
Conversely, traditional technical analysis often requires combining multiple tools and indicators, making the analysis process more complex. Traders need to evaluate various signals and make decisions based on those combined factors.Signal Timing
One of the key differences between price action and technical analysis is the timing of signals. Price action provides faster signals by observing real-time price behavior, helping traders identify reversal and trend change points sooner.
In contrast, technical analysis indicators typically provide delayed signals. For example, moving averages often generate entry or exit signals only after the price has already changed direction.Flexibility
Due to its simplicity, price action is applicable in all financial markets, including Forex, stocks, cryptocurrencies, and commodities. It can also be applied across all timeframes, from minute charts to weekly and monthly charts.
Technical analysis is also versatile, but traders often need to adjust indicators for each specific market and timeframe.Reliance on Experience
Price action heavily depends on the trader’s skill and experience. Identifying price patterns, market structure, and trader psychology requires extensive practice. Experienced price action traders typically develop their skills by observing charts for long periods and consistently practicing.
Conversely, traditional technical analysis relies more on indicator signals, making it easier for beginner traders to follow ready-made signals and enter trades more quickly.Emotional Control
In price action, trading decisions are strongly influenced by the trader’s judgment and experience. This can lead to emotional trading decisions during volatile market conditions. Conversely, technical analysis provides clearer, objective signals, reducing the risk of impulsive decisions.Key Tips for Success in Price Action
Consistent Practice: Learning price action requires frequent chart observation and practical experience.
Choosing the Right Timeframe: Selecting the appropriate timeframe based on your trading style is crucial. Short-term traders usually prefer lower timeframes, while long-term traders focus on higher timeframes.
Risk Management: Although price action provides precise signals, effective risk management and setting stop-loss levels are essential for successful trading.
Al Brooks Price Action

Al Brooks is one of the most well-known analysts and educators in the field of price action, who has developed a unique method for analyzing financial markets based on price movements. Al Brooks' price action system is highly regarded by many professional traders due to its precision and structured approach.
Introduction to Al Brooks
Al Brooks is a professional trader with extensive experience in financial markets. By relying on price action analysis, he has developed effective strategies for trading in various markets, including Forex, stocks, and futures. In his books, Brooks introduces advanced and in-depth concepts in the field of price action and offers new perspectives on market analysis.Principles of Al Brooks' Price Action
Al Brooks' price action method is based on several core principles:Analyzing Candles Individually
Al Brooks places great emphasis on analyzing each candlestick independently. In this method, traders must pay close attention to the shape, size, and position of each candle on the chart. Based on these characteristics, traders can identify signs of strength or weakness in buyers and sellers.Focus on Market Structure
Al Brooks emphasizes analyzing the overall market structure. He believes that understanding trends, corrections, and consolidation zones is crucial for making trading decisions.Concept of Pullbacks and Trends
Al Brooks places significant emphasis on pullbacks and price corrections. He believes these movements within trends provide excellent opportunities for re-entering trades in the direction of the trend.Identifying Gaps and Breakouts
Al Brooks asserts that understanding gaps and breakouts can offer powerful trading opportunities. He determines entry and exit points based on the strength and reliability of breakouts.Dynamic Support and Resistance Zones
In Brooks' method, support and resistance are not limited to static lines. He believes these levels should be continuously reviewed based on price behavior.
Key Strategies in Al Brooks' Price Action
Several strategies are featured in Al Brooks' price action system, with the most important ones being:Trend Trading Strategy
In this strategy, traders look for entry points in the direction of the main market trend. Entry is typically made during minor pullbacks or after confirmed breakouts.Range Trading Strategy
Al Brooks recommends that in non-trending markets, traders enter trades near support and resistance levels. In these conditions, attention to candlestick patterns that signal price reversals is crucial.Breakout Trading Strategy
Brooks emphasizes that not all breakouts are reliable; only breakouts accompanied by high volume and strong momentum are trustworthy. In his method, traders should wait for a candle to close above the breakout level before confirming the validity of the signal.
Advantages of Al Brooks' Price Action Method
The Al Brooks price action method has several distinctive advantages:
Offers a structured approach to analyzing price movements
Focuses on real price actions without relying on indicators
Enhances accuracy in identifying entry and exit points
Applicable to all financial markets and across multiple timeframes
Disadvantages of Al Brooks' Price Action Method
Despite its many advantages, this method also presents certain challenges:
Learning this system requires considerable time and continuous practice due to its extensive details
Brooks' method is based on precise candlestick analysis, which requires a high level of skill in recognizing price behavior
In highly volatile markets, more complex analysis may be necessary
The Al Brooks price action system is one of the most advanced methods for analyzing financial markets. By focusing on real price movements, this method helps traders make more informed and precise decisions. This method is ideal for those who wish to master price action and develop a deeper understanding of price behavior. However, success in implementing this method requires consistent practice, study, and substantial experience.
Al Brooks' Price Action Books
Al Brooks is one of the most recognized experts in price action who has published a series of comprehensive books detailing his advanced methods. His books are widely acclaimed by professional traders worldwide for their precise presentation of price action concepts. The most notable works by Al Brooks are as follows:Trading Price Action Trends
This book focuses specifically on analyzing market trends using price action. Al Brooks outlines multiple strategies for identifying trends, entry and exit points in trend directions, and managing trades. He emphasizes the importance of understanding trend structures and price behavior during these trends to help traders achieve better trading outcomes.
In this book, Brooks details how to identify strong and weak trends and how to spot pullbacks within trends to create profitable trading opportunities.Trading Price Action Reversals
In this book, Al Brooks focuses on identifying valid market reversals and utilizing them in trading. He introduces various methods for recognizing reversal signals and explains how traders can identify reversal points by analyzing candlesticks and reversal patterns.
Brooks explains how to enter trades near reversal points to maximize profits, as well as techniques for risk management and placing stop-loss orders in reversal trades.Trading Price Action Ranges
This book centers on analyzing range-bound and consolidating markets. Brooks believes that in non-trending markets, traders can identify support and resistance zones to create profitable trading opportunities.
In this book, Brooks explains how to recognize range markets and identifies optimal conditions for entering trades at support and resistance levels. He also outlines strategies for managing trades when the market lacks a clear trend.Reading Price Charts Bar by Bar
This book is one of the most comprehensive resources in the field of candlestick-by-candlestick analysis and is highly useful for both beginner and experienced traders. Al Brooks teaches how to read candlesticks and understand market psychology step-by-step.
This book explains how to analyze individual candlesticks to identify reversal points, breakout zones, and entry/exit points. A deep understanding of candlestick behavior and the psychology of buyers and sellers is a key feature of this book.The Brooks Trading Course
In addition to his published books, Al Brooks offers a comprehensive educational program titled The Brooks Trading Course, which includes video tutorials and detailed explanations of price action strategies. This course serves as a valuable complement to his books and helps traders gain a deeper understanding of price action concepts.Common Features of Al Brooks' Books
Al Brooks' books emphasize several key principles. He places significant focus on analyzing detailed price movements in the market and believes that understanding candlestick behavior allows traders to make more precise decisions. His books also highlight market psychology and the behavior of buyers and sellers.
These books provide step-by-step strategies for understanding trends, pullbacks, and valid breakouts. Brooks also offers important insights on capital management, setting stop-loss levels, and controlling emotions in trading.Best Approach to Studying Al Brooks' Price Action Books
Due to the complexity and detailed content of Al Brooks' books, studying them requires time and consistent practice. For better understanding, it is recommended to start with Reading Price Charts Bar by Bar to learn the fundamentals of price action.
After mastering the basics, continue with Trading Price Action Trends and Trading Price Action Reversals to improve skills in identifying trends, reversal points, and entry opportunities. Finally, to complete your learning, you can study Trading Price Action Ranges to enhance your expertise in trading range-bound markets.
Al Brooks' price action books are invaluable resources for mastering price action concepts. These books, with their comprehensive and step-by-step explanations, help traders develop their skills in financial market analysis. Achieving success with Al Brooks' methods requires continuous study, practice, and hands-on experience, but mastering these skills can significantly enhance your trading performance.
What is Scalping?
Scalping is one of the most popular strategies in financial markets, especially in the Forex, cryptocurrency, and stock markets. This trading method is designed based on earning small profits in short-term time frames. Scalpers, in this style, aim to profit from minor price fluctuations by frequently entering and exiting the market.
The scalping method is a short-term trading style that has a direct connection with price action. Scalpers usually rely on price action and candlestick patterns to identify quick entry and exit points in the market. In fact, price action is one of the most important analytical tools for scalpers because trading opportunities in this method are identified in short-term time frames, and indicators are less effective due to their delayed signals.
Scalpers typically operate in lower time frames such as the 1-minute (M1)or 5-minute (M5)charts. In these short time frames, price action provides fast and precise information that helps scalpers make quick decisions. Some of the key price action techniques commonly used in scalping include:Candlestick Patterns
Scalpers use candlestick patterns such as Pin Bar,Engulfing, and Inside Bar to identify reversal points and quick breakouts in the market. These patterns can provide strong reversal signals in lower time frames.Support and Resistance Levels
Scalpers often utilize key support and resistance levels to identify entry and exit points. In this method, when the price interacts with significant levels and shows reversal or breakout signs, it provides a suitable opportunity for a quick trade.Price Behavior at Key Points
Price action in scalping helps traders identify price behavior at key points such as pullbacks,fake breakouts, and consolidation zones. Recognizing these behaviors enables scalpers to exploit short-term trading opportunities effectively.Combining Price Action with Risk Management
Scalpers who apply price action strategies usually set very tight stop-loss orders to prevent significant losses in case of an incorrect trade entry. This precise risk management, combined with accurate identification of price movements, is one of the key factors contributing to success in this method.
What is Swing Trading?
Swing trading is one of the popular strategies in financial markets where traders aim to profit from price fluctuations in medium-term time frames. Unlike scalping, which focuses on short-term trades, swing traders typically hold their positions for several days to several weeks. The primary goal in swing trading is to identify swing points and profit from these price movements.Who is Swing Trading Suitable For?
Swing trading is ideal for traders who prefer to manage their trades without constantly monitoring the market. This method is suitable for individuals who want to spend less time analyzing the market each day but still seek profitable trading opportunities.