
What Is Spread?
Spread refers to the difference between the bid price and the ask price of a currency pair or an asset. It is essentially a type of indirect commission that brokers and market makers use to cover their costs and generate profit. This is because, in many trading accounts, instead of charging a direct commission, brokers earn their income through the spread.
The spread may vary depending on different conditions; factors that can cause an increase or decrease in the spread include active market hours, the type of currency pair, economic news and sharp price volatility, the type of broker, trading volume, and the type of trading account. The spread also plays an important role in overall market performance, including reducing the risk of sudden volatility, providing liquidity, creating price stability, and ensuring sustainable profitability for brokers.
Why Use a Spread Indicator in MetaTrader 5?
In the MetaTrader 5 platform, the spread value is always available numerically in the Market Watch window or the price section, but this numerical display is not always sufficient. When the spread is shown only as a number, it is difficult to observe its trend and fluctuations over time. However, when a spread indicator is used, this value is displayed as a line or histogram on the chart, making it easy to see spread fluctuations for example, identifying the periods when the spread has increased. This visual representation helps you make decisions more quickly and with better clarity.
The forex market can sometimes become highly unstable and volatile, especially during the release of major economic news or global events, when market liquidity decreases and brokers widen spreads. If you only look at the spread number, you may not notice rapid fluctuations, but a spread indicator on the chart clearly shows these sudden changes, warning you that it is not a suitable time to trade due to higher costs, and helping to reduce the risks associated with sudden increases in trading expenses.
Professional traders know that entering a trade when the spread is high means paying higher costs and reducing the probability of profitability. The spread indicator clearly shows the times when the spread has reached an acceptable level and helps you avoid entering trades during periods of high spread, resulting in more cost efficient and optimized trading.
Risk management is one of the core principles of trading, and when the spread suddenly widens, price may need to move further to reach profit before hitting the stop loss. The spread indicator helps you quickly identify such situations and avoid trading under unfavorable conditions, which in turn reduces potential losses caused by large spreads.
Scalpers and short term traders who execute a large number of trades throughout the day are highly sensitive to spread levels, as wide spreads can completely eliminate their small profits. For these traders, the spread indicator is an essential tool for identifying low spread entry points and enables faster and more effective decision making.
Finally, the spread indicator is generally visual and easy to use, allowing even beginner traders to quickly recognize changes in the spread and easily follow its trend without the need for complex numerical analysis.
How the Spread Indicator Works in MT5
The spread indicator in MetaTrader 5 calculates the difference between the bid price and the ask price using real time pricing data sent by the broker’s server. This difference, which represents the spread, is usually displayed in pips or points, and the indicator visualizes it on the price chart in graphical forms such as a line or a histogram.
This visual representation allows traders to observe spread fluctuations accurately and in real time over a given period, making it easier to analyze the trend of spread changes. In addition, some indicators calculate and display the average spread over different time intervals, giving traders a broader perspective on spread behavior during various market hours and helping them identify optimal times to trade with lower spreads.
The indicator automatically receives and updates data from the broker’s server in real time, ensuring that traders always have access to accurate and up to date information. It is worth noting that the spread value depends on the type of trading account and the broker, and the indicator merely displays the actual spread without altering it. Some spread indicators offer more advanced features, such as sound alerts or notifications when the spread widens, automatic color coding to represent different spread levels, customizable timeframes for spread analysis, and compatibility with various instruments, including currency pairs, metals, and cryptocurrencies.
Using this indicator helps traders avoid entering trades during periods of high spread and execute more optimized, lower cost trades, which is especially important for scalpers and short term timeframe traders. Ultimately, the accuracy and performance of the indicator depend entirely on the data provided by the broker and the type of trading account, and through it, traders can achieve better risk management and make more informed trading decisions.
The Best Trading Strategies for the Spread Indicator
Before examining each strategy individually, it should be noted that the spread indicator is most effective when its changes are analyzed within the context of market liquidity and the behavior of major market participants. Accordingly, the first approach focuses on identifying sudden spread contractions as a signal for the beginning of a meaningful market move.
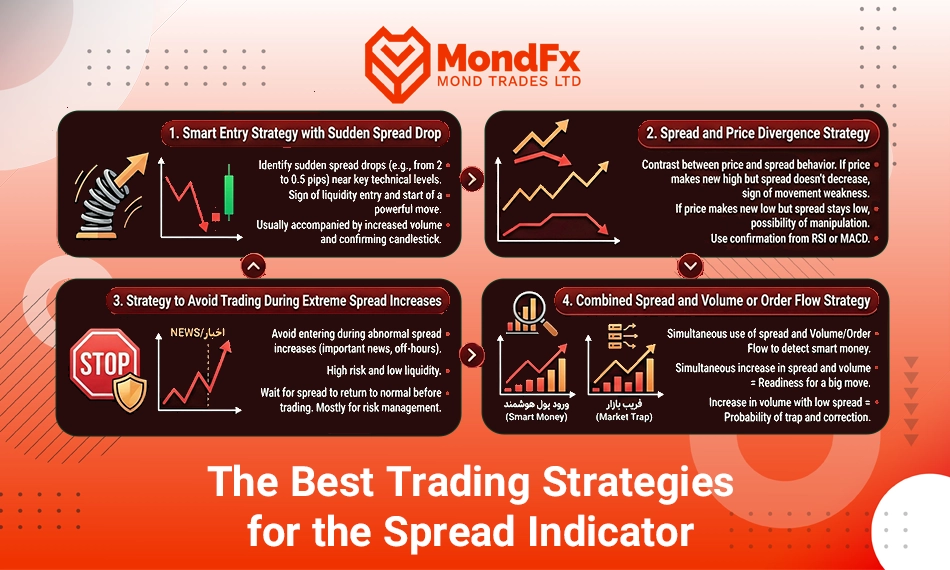
Smart Entry Strategy Based on Sudden Spread reduction
In many cases, one of the signs of fresh liquidity entering the market and an increase in trading activity is a sudden narrowing of the spread between the bid price and the ask price. Under normal conditions, a wide spread indicates low liquidity or intense volatility and suggests that the market has not yet made a decisive move. However, when the spread suddenly narrows especially near key technical levels such as support or resistance it can be considered a sign of large players entering the market and the start of a strong price movement.
In this strategy, you first identify the relevant level, then wait for the spread to suddenly decrease (for example, from 2 pips to 0.5 pips). This event is usually accompanied by an increase in volume and the appearance of a confirmation candle such as a pin bar, an engulfing pattern, or candles with long wicks. Combining spread contraction with a price action signal provides a suitable point for entering a buy or sell position, particularly in markets with floating spreads such as forex or cryptocurrencies.
Spread and Price Divergence Strategy
In this strategy, the focus is on the discrepancy between price behavior and spread behavior; in other words, when price is forming new highs or lows but the spread does not move in alignment with it, a type of divergence has occurred. For example, if the price of Bitcoin is breaking a historical resistance level and recording a new high, but the spread not only fails to narrow and instead widens, this may indicate market hesitation and a lack of sufficient liquidity behind the bullish move. Conversely, price may be declining while the spread remains suspiciously low, which can be a sign of artificial pressure or market manipulation.
In such conditions, by using indicators such as RSI or MACD for confirmation, potential trend reversal opportunities can be identified. Spread price divergence often appears at the end of trends or during the formation of double tops and double bottoms and can serve as a powerful signal of the strength or weakness of a market move.
Strategy for Avoiding Trades During Sharp Spread Widening
One of the common mistakes among beginner traders is entering trades during periods when the spread increases abnormally, such as during the release of major economic news or in inactive market hours. At these times, the market experiences intense volatility and low volume, and brokers significantly widen spreads to manage their own risk. A professional trader, instead of entering trades under such conditions, uses the spread indicator to wait for the spread to return to normal levels.
For example, during the release of U.S. Non Farm Payrolls (NFP) data, the spread on currency pairs such as EUR/USD or GBP/USD may widen from 1 pip to more than 5 pips. Such conditions are not suitable for trading, because in addition to higher costs, the risk of liquidation due to sudden price fluctuations increases. After volatility subsides and the spread returns to its previous level, traders can enter the market more calmly and with more precise analysis.
This strategy is more focused on risk management and trade filtering rather than on position entry.
Combined Spread and Volume or Order Flow Strategy
In this advanced approach, you use the spread indicator alongside professional tools such as volume indicators(Volume Profile) or Order Flow charts to identify the entry or exit of smart money. An increase in spread simultaneous with rising volume can be a sign of large traders entering the market. For example, if the spread is widening while trading volume is increasing, it can be interpreted that major market participants are building positions, and this spread expansion is not a sign of weakness, but rather a sign of preparation for a significant move.
Conversely, if volume is increasing while the spread remains unusually low, the market may be misleading retail traders, and price could experience a sudden correction. This strategy requires accurate data and access to advanced platforms such as ATAS, Sierra Chart, or Bookmap, but when combined with spread analysis, it can provide precise and early signals.
Conclusion
The spread indicator in MetaTrader 5 is an important and practical tool for traders at all levels, enabling the visual observation and analysis of real time spread changes. This tool not only helps identify rapid market fluctuations and avoid entering high cost trades, but also, when combined with other technical analysis tools such as price action, trading volume, and order flow data, allows for the accurate identification of optimal entry and exit points.
The strategies introduced in this article including smart entry based on sudden spread contraction, spread and price divergence, avoiding trades during periods of high spread, and combining spread analysis with volume data help traders make more precise trading decisions and manage trading risk more effectively. The importance of this tool is particularly high for short term traders and scalpers due to their sensitivity to trading costs and rapid market fluctuations.
Ultimately, using the spread indicator leads to optimized trading costs, increased market transparency, and more informed trading decisions. By mastering this tool and its related strategies, traders will be able to improve their trading performance and achieve a more professional level of risk management and market opportunity utilization.
If you are looking to start a reliable path in the world of trading and financial markets, collaborating with the MondFx team can be a good starting point for building your personal trading strategy.
Frequently Asked Questions (FAQ)
What is the spread indicator in MetaTrader 5 and what is it used for?
The spread indicator is a tool that visually displays real time changes in the spread between the bid and ask prices on the chart, helping traders better observe and manage market fluctuations.
Is using the spread indicator suitable for beginner traders?
Yes, the spread indicator is generally visual and easy to use, and even beginner traders can quickly identify spread trends and make more cost efficient and optimized trading decisions.
How can the spread indicator be used for risk management?
By using this indicator, traders can identify periods when the spread has increased abnormally and avoid entering high cost trades, which helps reduce potential losses.
Can the spread indicator be combined with other analysis tools?
Yes, this indicator can be combined with tools such as price action, trading volume, and order flow data to identify more precise entry and exit points and create more effective trading strategies.
Are spread indicator data always accurate?
The accuracy of the spread indicator depends on the data provided by the broker and the type of trading account. The indicator simply displays these data in real time without modification.
What are the benefits of using a spread indicator for scalpers?
For short term traders and scalpers who execute a large number of trades throughout the day, the spread indicator helps identify periods of low spread, enabling more profitable and lower cost trading.