
Trading volume is one of the key indicators in financial market analysis, showing how many contracts or assets have been traded within a specific period of time. This information goes beyond price fluctuations and provides a clear picture of the level of market participant involvement and the strength of price trends. For example, if the price of a stock is rising while trading volume is decreasing, this upward move is likely not sustainable. In contrast, a simultaneous increase in both price and trading volume can confirm an uptrend and attract analysts’ confidence. In this context, volume indicators are considered vital tools; these indicators help analysts reveal the hidden layer of the market, namely, the actual level of trader participation and make better decisions. By using these tools, it is possible to measure the real impact and true strength of the market behind every price movement. In this article from MondFx, join us as we examine volume indicators and how to use them.
The Importance of Volume Indicators in Technical Analysis and Volume Based Strategies
Volume indicators play a key role in technical analysis , as they allow analysts to determine whether a price movement is merely a short term fluctuation or supported by real momentum and active trader participation. These indicators are typically used as complementary tools alongside trend indicators, momentum indicators, or oscillators to provide a more complete picture of market behavior.
By analyzing volume, the strength and weakness of trends can be assessed. For example, when the price of an asset is rising while trading volume is declining, the probability of a trend reversal increases. Conversely, when a price increase is accompanied by rising volume, it indicates the inflow of smart money and the consolidation of an uptrend. This type of analysis provides more accurate signals, especially around support and resistance levels.
Indicators such as On Balance Volume (OBV), Volume Profile, Volume Weighted Average Price (VWAP), and Accumulation/Distribution are among the well known tools in this field. Each of these indicators has its own specific strategy; some are used to identify the entry and exit of smart money, others to determine key price levels, and some to filter out false signals in trend following trades.
Strategies designed based on volume indicators usually have higher accuracy, as they consider both price movement and the collective behavior of traders. For this reason, many professional traders place these indicators at the core of their trading systems.
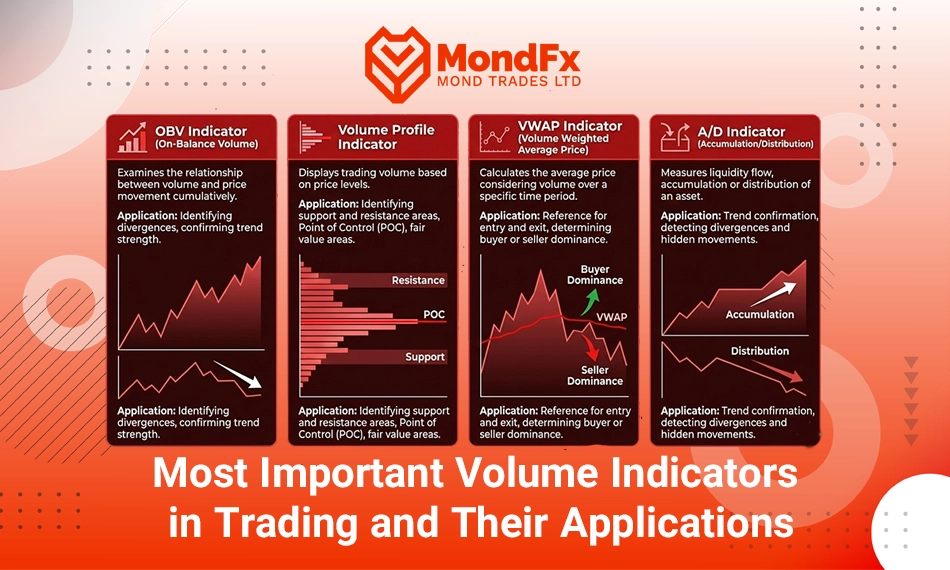
Most Important Volume Indicators in Trading and Their Applications
In technical analysis, trading volume is one of the key elements in confirming price movements and understanding market trading psychology. Volume can be considered the fuel behind price movement; in other words, the greater the volume supporting a move, the higher the probability of its strength and sustainability. To make better use of this data, analysts employ specific indicators that present volume information in a visual and analyzable form.
Among the most important of these indicators, we can refer to the following:
On Balance Volume (OBV) Indicator
The OBV indicator is one of the classic and widely used tools in volume analysis, aiming to examine the relationship between volume and price movement. In this indicator, daily volume is recorded cumulatively; that is, if today’s closing price is higher than yesterday’s, that day’s volume is added to the total, and if it is lower, the volume is subtracted from the total. In this way, OBV seeks to reveal the hidden buying and selling pressure in the market.
The primary application of OBV is in identifying divergences and confirming trends. For example, if the price of a stock is rising but OBV fails to register new highs, this can serve as a warning of trend weakness and a potential reversal. On the other hand, a simultaneous rise in both price and OBV is considered a sign of a healthy and strong uptrend.
Volume Profile Indicator
Unlike many indicators that analyze volume data along the time axis, the Volume Profile indicator displays trading volume based on price levels. This indicator shows at which prices the highest trading volume has occurred. One of the most important components of the Volume Profile is a point known as the Point of Control (POC), which identifies the price level with the highest traded volume.
The main application of the Volume Profile is identifying support and resistance zones. These areas are usually levels where traders previously showed strong interest in buying and selling, and therefore market reactions can be expected around them. Additionally, Volume Profile helps determine whether the price is currently trading within a fair value area or in a zone with a high probability of reversal.
Volume Weighted Average Price (VWAP) Indicator
VWAP is one of the most popular indicators among day traders and active participants in the stock market. This tool calculates the average traded price over a specific period (usually daily), taking into account the volume of each trade. Simply put, VWAP shows the average price at which the market has traded, weighted by volume.
Many traders use VWAP as a reference for smart entry and exit decisions. For example, if the price moves above the VWAP, it indicates buyer dominance in the market and may present a buying opportunity. Conversely, when the price trades below the VWAP, it may signal selling pressure. This indicator is particularly useful for scalping strategies and day trading.
Accumulation/Distribution (A/D) Indicator
The A/D indicator is also an important tool for measuring capital flow in the market. It attempts to identify the level of accumulation or distribution of an asset by combining closing price and trading volume. When the price closes near the daily high with high volume, it indicates strong buying and accumulation. Conversely, if the price closes near the daily low, it usually signals selling pressure and asset distribution.
The A/D line can be used as a trend confirmation tool or for divergence analysis. When the A/D line is rising while the price remains range bound or even declining, it suggests that buyers may be accumulating the asset and that a potential uptrend could be ahead. This indicator is especially effective in identifying hidden movements of large investors and tracking the inflow and outflow of smart money.
Final Words
Overall, volume indicators are considered vital tools for analysts and professional traders. These indicators go beyond pure price analysis and provide insight into the actual level of market participation and the strength of trends, adding greater accuracy and confidence to trading decisions.
The smart use of tools such as OBV, Volume Profile, VWAP, and A/D helps traders better identify optimal entry and exit points, support and resistance levels, and capital flow. By combining these indicators alongside other technical analysis tools, stronger and more effective trading strategies can be developed that reduce risk and increase the probability of success. For this reason, a thorough understanding of volume indicators and their practical application is one of the fundamental pillars of any professional trading system.
If you are looking to start a reliable path in the world of trading and financial markets, collaborating with the MondFx team can be a good starting point for building your personal strategy.
Frequently Asked Questions (FAQ) About Volume Indicators
What exactly does trading volume show?Trading volume represents the number of assets that have been traded within a specific period of time. This metric helps analysts assess the level of market participation in price movements and determine whether the current trend is supported by the market or not.Why is analyzing volume alongside price important?Because price alone can be misleading. A price increase with low volume may indicate a weak trend, whereas a price increase accompanied by high volume signals the inflow of smart money and confirms the strength of the trend.Which volume indicator is more suitable for identifying smart money inflows?Indicators such as OBV and Accumulation/Distribution are effective tools for identifying the entry or exit of smart money. These indicators combine price changes with volume to reveal hidden buying and selling pressure.What is the difference between Volume Profile and VWAP?Volume Profile displays volume based on price levels and is very useful for identifying support and resistance zones.
VWAP is the volume weighted average price and shows the price level at which the market has traded on average; this indicator is mainly used in day trading and scalping.Can trading be done using only volume indicators?No. Volume indicators alone are not sufficient, but they can play a very important complementary role alongside tools such as moving averages, RSI, MACD, or price patterns, significantly increasing the accuracy of a trading strategy.Which time frames are more suitable for volume analysis?Different time frames serve different purposes. For short term analysis (scalping or day trading), time frames from 5 to 30 minutes are useful, while for medium or long term analysis, hourly, daily, or weekly time frames can be used.What is the best way to identify divergence between price and volume?Divergences can be identified using indicators such as OBV or A/D. For example, if the price is rising while OBV is declining, this divergence can be a warning of a weakening trend.Are volume indicators effective in low liquidity markets?In low liquidity markets, volume data may be less reliable; however, they can still be used with caution, especially for identifying key levels or sudden inflows of capital.