
Order Flow is the process of transmitting and executing buy and sell orders in financial markets. This analytical tool helps traders better understand what lies behind price behavior, buying and selling pressure, and the intentions of the main market participants. In this article from MondFx, we aim to understand why traditional education and old school market skills, and knowing what is visible on the surface of charts, are no longer sufficient. Why professional traders have, for years, gone beyond candles and indicators and sought to decode what is happening beneath the skin of the market: namely, the factor known as Order Flow. But what exactly is Order Flow? How many types does it have? And most importantly, why should we take it seriously? Join us to get the answers.
order flow definition
Order Flow, in simple terms, means examining and analyzing how buy and sell orders enter specific market levels. Every time a buyer makes a purchase or a seller places a sell order, it leaves an impact on the market flow. Order Flow analysis means tracking these impacts to predict the direction of the market.
For example, if buy orders suddenly increase, it may indicate buying pressure that pushes prices upward. Conversely, an increase in the volume of sell orders can be a sign of a price decline. Analyzing and following this flow of transactions makes it easier for traders to understand market movements and, in addition to simplifying the trading process for traders, it greatly helps the trading analysis flow and risk management in trades.
Types of Order Flow
In order flow analysis, we encounter different types of orders and data. Below, we review the most important types:

Market Orders
This type of order is executed when a trader wants to enter the market immediately. A Market Order is filled at the nearest available price in the Order Book. This type of order plays a primary role in price movement, because Market Orders absorb existing Limit Orders.
Example: A buyer wants to purchase Bitcoin right now. They place a Market Order, and the system executes it against the nearest available sell order.
Limit Orders
In a Limit Order, the trader specifies the price at which they are willing to buy or sell. This order is placed into the Order Book and is not executed until an opposing order appears at that price. This type of order increases market liquidity.
Example: A seller holds Bitcoin and is only willing to sell it at a price of $70,000. They place a Limit Sell Order at this price level.
Stop Orders
This type of order is typically used for risk management or for entering the market at specific levels. A Stop Order remains inactive until the market price reaches a specified level, and once triggered, it is converted into a Market Order or a Limit Order.
Example: A trader may set a Stop Loss at $68,000 so that if the price of Bitcoin falls below this level, the position is closed.
Order Flow Data
In this section, we move into more advanced Order Flow analysis, which includes more specialized and in depth data related to orders:
Footprint Chart
This chart is a special type of chart that displays the volume of executed orders at each specific price. Using this tool, one can identify where buying or selling pressure was stronger within each candle.
Delta
Delta is the difference between the volume of buy orders (Market Buy) and sell orders (Market Sell). If Delta is positive, it means buyers had more strength, and vice versa.
Order Book Depth
This shows market depth (Level 2), indicating how much volume of limit orders exists at each price level. These data allow you to see live support and resistance zones in the market.
What Does Order Flow Indicate?
In this section of the article, the details of order flow are examined:
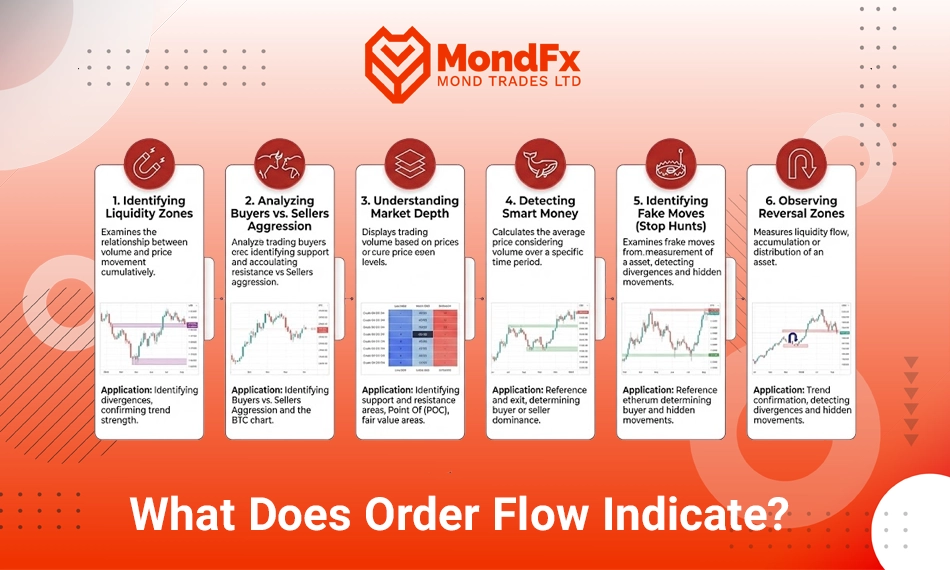
Identifying Liquidity Zones
Order flow clearly shows where market liquidity is concentrated. Liquidity zones are areas where a significant volume of buy or sell orders has accumulated; in other words, areas where many buyers or sellers are waiting for the price to reach a certain level to enter trades. These zones often act like magnets, attracting price toward them, because market makers are interested in executing their orders at these levels.
For example, if there is a high volume of buy orders at the price level of 1.2000 in the EUR/USD currency pair, there is a strong probability that after the price declines to this level, it will react and rebound. Such a reaction may be a sign of smart money or whale participation in this area.
Analyzing Buyers vs. Sellers Aggression
By examining order flow, it is possible to determine whether buying pressure or selling pressure is stronger at any given moment. This analysis is achieved by observing Market Orders versus Limit Orders. If the number of market buy orders exceeds the number of limit sell orders, it indicates buying pressure and an increased likelihood of price appreciation.
For example, imagine that in Bitcoin trading, high volume buy orders are continuously entering the market, while sell orders fail to push the price lower. This situation indicates aggressive buyer behavior and may cause the price to surge rapidly.
Understanding Market Depth
Another advantage of technical analysis through Order Flow is observing the true depth of the market. Market depth shows how much liquidity exists at different price levels. By examining this data, it is possible to predict whether the price will easily pass through a specific level or not. If there is a large wall of sell orders at a certain price, the probability of breaking through that level without the entry of significant volume is low.
For example: if in the crude oil market, at the price of $75 per barrel, there are 5,000 lots of sell orders placed in the order book, this indicates strong resistance in that area. Until these orders are absorbed or removed, the likelihood of the price rising above $75 will be low.
Detecting Smart Money Entry (Smart Money Detection)
By carefully analyzing order flow, it is possible to identify the movements of large players, also known as smart money. They often use split and hidden orders to enter the market in order to avoid attracting attention. Signs of smart money entry include the sudden appearance of large orders, increased volume at specific levels, or unusual changes in the bid ask spread.
For example, in the forex market, multiple sell orders with relatively small volumes may be observed at the 1.0850 level, but suddenly, at a specific moment, a large number of buy orders enter the market as Market Orders and aggressively push the price higher. This behavior can be a sign of smart money entering the market quietly.
Identifying Market Manipulation and Fake Moves
One of the advanced applications of order flow is identifying deceptive market movements. At times, large players deliberately push the price toward specific levels to trigger retail traders’ stop loss orders (commonly referred to as stop hunts) and then move the market in the intended primary direction. These types of moves are usually accompanied by a rapid increase in volume and a sharp price reversal.
For example, in the Ethereum cryptocurrency market, the price may quickly drop to the 1,850 level and immediately after triggering buyers’ stop loss orders, rebound back above 1,900. In such cases, order flow through a sudden spike in selling followed by aggressive buying warns us of these deceptive moves.
Observing Price Reversal Zones
Order flow analysis allows us to identify potential price reversal points. When a massive volume of orders is absorbed at a specific level, yet the price shows no willingness to continue in the same direction, it can be inferred that this level is likely to act as a reversal zone.
For example, in NASDAQ index trading, if sell orders repeatedly enter the market at the 14,000 level and the price fails to break through it, strong buyer participation may gradually emerge, causing the price to change direction and begin an upward trend. This reversal can be detected through order flow even before it becomes visible on the chart.
Final Words
In conclusion, order flow is a powerful tool for gaining a deep understanding of market behavior and making informed trading decisions. Going beyond candles and indicators, this analysis provides a clear picture of buying and selling pressure, market depth, smart money entry, and liquidity zones. By using Order Flow, traders can identify optimal entry and exit points, price reversal zones, and even deceptive market moves, while reducing their trading risk.
For this reason, mastering order flow is one of the key skills for any professional trader, and a precise understanding of it can make the difference between a superficial analysis and a successful trading strategy.
MondFx, by providing continuous education and guidance, enables gradual progress along the path of developing a personalized strategy and practicing informed trading.
Frequently Asked Questions (FAQ)
What exactly is Order Flow?
Order Flow is the process of order entry and execution of buy and sell orders in the market, which helps traders analyze the hidden behavior behind price movements, buying and selling pressure, and the intentions of major market participants.
Why are candlestick analysis and indicators alone not sufficient?
Because price alone cannot provide a complete picture of the market. Order flow shows how much real participation exists behind each price movement and whether smart money has entered the market or not.
What are the main types of orders in Order Flow?
The main orders include Market Orders, Limit Orders, Stop Orders, and advanced Order Flow data. Each plays a specific role in market analysis and in understanding buying and selling pressure.
What information does Order Flow provide?
By analyzing Order Flow, traders can identify liquidity zones, buyer and seller behavior, market depth, smart money entry, fake market moves, and price reversal points.
How can smart money entry be identified through Order Flow?
Smart money entry is usually characterized by large and sudden orders, unusual changes in volume and spreads, and aggressive movements that occur without attracting broad market attention.
Is Order Flow applicable to all markets?
Yes, but its accuracy varies depending on the depth and transparency of the market. In low liquidity markets or those with unreliable volume data, Order Flow analysis should be applied with caution.
How are price reversal points identified using Order Flow?
When a large volume of orders is absorbed at a specific price level but the price fails to continue moving, there is a high probability of a trend reversal. Such points can be identified through Order Flow.
Can trading be done using only Order Flow?
No. Order Flow is best used alongside other technical analysis tools such as indicators, chart patterns, and moving averages to improve the accuracy and quality of trades.