
Spreadsheets are tools used for organizing, analyzing, and calculating data. These software applications, such as Microsoft Excel and Google Sheets, allow users to store data in tables with rows and columns and perform complex operations like mathematical calculations, statistical analysis, and creating charts. Spreadsheets are widely used across various industries, especially in financial markets, for planning, financial analysis, and reporting, with over 800 million users worldwide. A spreadsheet is a software application that allows you to organize data in the form of two-dimensional tables and use it for further analysis and various calculations. This software typically includes a set of rows and columns where data can be entered, and then complex calculations can be performed using formulas.
In many industries, especially in financial markets, spreadsheets are essential tools for organizing information and performing financial and economic analyses. Some of the most well-known spreadsheet software includes Microsoft Excel and Google Sheets, each with its unique features and capabilities.
What is Spread in Forex?
In the forex market, the spread refers to the difference between the bid price (buy price) and the ask price (sell price) of a currency pair. This difference is often considered one of the key factors in determining the costs of a trade for traders and investors. In essence, the spread is the cost that traders pay to enter a trade, and it indirectly acts as a commission for the broker or exchange.
Bid Price and Ask Price
In the forex market, there are two different prices for each currency pair. The ask price is the price at which the market is willing to sell the currency, while the bid price is the price at which the market is willing to buy the currency. The spread is naturally calculated as the difference between these two prices. For example, if the bid price of a currency pair is 1.2500 and the ask price is 1.2503, the spread for that currency pair is 3 pips.
Fixed and Variable Spread
The spread can vary depending on the market conditions and broker. Sometimes the spread may be fixed, while in other instances, it may be variable. A fixed spread is typically observed in major currency pairs like EUR/USD, while a variable spread is more common in less traded currency pairs or during periods of high market volatility.
Impact of Spread on Trading Strategies
The amount of the spread can have a significant impact on trading strategies and profitability. For example, in short-term trading and scalping, which rely on short-term price movements, a lower spread is very important, as transaction costs can quickly affect the trader’s profit and loss.
Importance of Spread in Choosing a Broker
As a result, the spread is an important factor that traders should consider when choosing a broker and selecting currency pairs to trade, as this price difference can directly affect the profits and losses of their trades.
Applications of Spreadsheets in Financial Markets
Spreadsheets are powerful tools in financial markets used for performing financial and business analysis, playing a vital role in strategic decision-making and managing complex data. These tools are particularly useful in areas that require precise calculations and extensive analysis. Spreadsheets can be used to perform complex calculations, analyze market trends, manage risk, and predict prices. Below are various applications of spreadsheets in financial markets.
1.Calculating Spread
In financial markets, the spread refers to the difference between the bid price and the ask price of an asset. This difference is typically one of the key factors in determining the cost of executing a trade for traders and investors. Spreadsheets serve as a precise and effective tool for calculating the spread in various trades. Using a spreadsheet, different spreads for assets such as cryptocurrencies, stocks, and commodities can easily be calculated, and necessary analyses can be performed. This tool can help identify spread patterns and potential weaknesses in trading strategies.
2.Risk Management
Risk management is a crucial element in decision-making within financial markets. In volatile and high-risk environments like cryptocurrency and stock markets, managing risk can make the difference between significant profit and loss. Spreadsheets are useful tools for tracking and managing risk in trades. These tools allow investors and traders to calculate the risks present in their investment portfolios, set desired risk levels, and develop optimized strategies to reduce these risks. Furthermore, spreadsheets can simulate different market conditions and analyze how these conditions affect assets and portfolios.
3.Portfolio Performance Analysis
One of the primary applications of spreadsheets in financial markets is portfolio performance analysis. Investors can use spreadsheets to track the performance of their various assets over time. These tools allow financial analysts to measure the profits and losses of each asset within a given time frame and accurately assess their portfolio’s status. Additionally, spreadsheets can help identify weaknesses in an investment portfolio so that investors can make better decisions regarding the buying and selling of assets. Moreover, these tools can easily analyze the impact of market volatility on the portfolio and its changes.
4.Market Forecasting
Predicting prices and market trends is one of the main challenges in financial trading. Spreadsheets are effective tools for modeling markets and conducting forecasting analyses. By using historical data and complex formulas, spreadsheets can be used to analyze past market trends and simulate future trends. These tools are particularly useful in technical and fundamental analyses, allowing traders and analysts to make predictions based on real data. Spreadsheets can help investors identify market patterns and make decisions based on more accurate price predictions.
5.Reporting and Data Analysis
Spreadsheets are used not only for analyzing financial data but also for reporting and preparing financial documentation. These tools allow companies and investors to easily generate complex and specialized financial reports. These reports include profit and loss statements, balance sheets, and liquidity reports. Additionally, spreadsheets can be used to analyze the financial status of a project or company and compare its performance against established goals.
6.Simulating Different Scenarios
One of the very useful applications of spreadsheets in financial markets is the ability to simulate various scenarios. Especially in times of high market volatility or special conditions, spreadsheets can help simulate different market conditions and predict how these conditions might affect assets. These simulations allow investors to test various strategies and make the best decisions in fluctuating circumstances.
Advantages of Using Spreadsheets
Using spreadsheets in financial markets has many advantages that can help improve the accuracy and efficiency of financial processes. Some of these advantages include:
High accuracy in calculations: Spreadsheets perform financial calculations with high precision using complex formulas and functions.
Ability to perform complex analyses: These tools allow you to analyze financial data and derive various results.
High flexibility: Spreadsheets give users the ability to easily modify data and convert it into different formats.
Ability to use charts and graphs: You can display your data in the form of charts and graphs, which greatly aids visual analysis.
Difference Between Spreadsheets and Other Similar Tools
While spreadsheets are powerful tools for data analysis, they do not cover all your needs in managing financial information on their own. Compared to other similar tools such as databases or specialized accounting software, spreadsheets may have limitations. One of the main differences is that spreadsheets are generally more suitable for smaller datasets and simpler applications, whereas for larger and more complex datasets, using database software may be more appropriate.
Training on Using Spreadsheets for Data Analysis
Spreadsheets are powerful tools for managing and analyzing data in financial markets. These tools allow users to easily organize various data in neat and organized tables and use them for performing complex analyses. In this section, we will discuss how to use spreadsheets for analyzing data in financial markets.
Entering Data into a Spreadsheet
To start working with spreadsheets, you first need to enter the required data into the tables. This data can include historical prices, trading volumes, exchange rates, and any other data you need for market analysis.
Calculating Spread in a Spreadsheet
One of the important uses of spreadsheets in financial markets is calculating the spread. The spread refers to the difference between the bid price and the ask price of an asset. Using spreadsheets, you can easily calculate this difference and track its changes over time.
Using Spreadsheets for Risk Management
Spreadsheets can be used for more complex analyses, such as risk management and simulating various scenarios. For example, you can make predictions about changes in the spread under different market conditions and assess their impact on your trading strategies.
Technical Analysis with Spreadsheets
Another application of spreadsheets is technical analysis. In technical analysis, historical price data and trading volumes are used to predict future trends. Spreadsheets can help you accurately analyze this data and create various charts such as candlestick charts, line charts, and bar charts.
Using Mathematical and Statistical Functions in Spreadsheets
For more advanced analysis in spreadsheets, you can use various mathematical and statistical functions such as averages, standard deviations, regression models, and correlation analysis. These functions help you simulate the relationships between different market variables and make more accurate predictions about prices and market changes.
Portfolio Management with Spreadsheets
Spreadsheets also offer tools for portfolio management. Investors can use spreadsheets to track and manage their portfolios. By entering information about asset purchases and sales, profits and losses, and related fees, they can monitor the status of their portfolio in real-time and make better decisions for optimizing it.
Market Prediction and Price Modeling
Spreadsheets can also be useful tools for market prediction and price modeling. By using past data, you can simulate market trends and make predictions for the future.
The Future of Spreadsheets in Financial Markets
Spreadsheets are recognized as very powerful and flexible tools in financial markets. With the growing need for complex data analysis and smarter financial decision-making, spreadsheets, especially in volatile and dynamic environments like financial markets, will continue to play a key role. In this section, we will explore the future of spreadsheets in financial markets and discuss their potential challenges and opportunities.
Integration with New Technologies
One of the most important future trends for spreadsheets is their integration with new technologies such as Artificial Intelligence (AI), Machine Learning (ML), and Big Data analytics. By using these technologies, spreadsheets will be able to offer more accurate market trend predictions and allow analysts and investors to make better decisions. For example, using machine learning algorithms can allow spreadsheets to simulate market trends and even predict future price changes.
Move to the Cloud
Another significant aspect of the future of spreadsheets is the shift to cloud-based platforms. Currently, software such as Google Sheets and Microsoft Excel Online allows data to be stored online and accessed from anywhere at any time. This feature makes spreadsheets excellent tools for team collaboration and project management in financial markets. In the future, it is expected that more organizations will use cloud-based spreadsheets to manage data and share analyses in real-time online.
Increased Processing Power and Analytical Capabilities
The increase in processing power of spreadsheets is another important trend in the future. With technological advances and the increasing power of data processing, spreadsheets will be able to process large volumes of data more quickly and perform more complex analyses. This feature is particularly important in financial markets, where large amounts of real-time and historical data are involved. Additionally, spreadsheets are expected to be equipped with more advanced analytical capabilities, including advanced financial modeling, technical and fundamental analysis, and automated risk analysis.
Smart Automation
In the future, spreadsheets will be able to smartly and automatically input data, apply necessary updates, and perform more precise analyses. This automation will reduce the need for manual data processing and significantly decrease the time required to prepare financial reports and analyses. Furthermore, spreadsheets will be able to automatically extract market data and analyze changes in data in real-time.
Increased Inter-Organizational Interactions
Another aspect of the future of spreadsheets in financial markets is the increased inter-organizational interactions and more collaboration among investors, analysts, and companies. Since spreadsheets can be shared online and will have high processing power, these tools can serve as instruments for participating in joint projects and group analyses on a global scale. This feature will be particularly useful in complex industries like financial markets, where joint analysis is necessary.
Potential Challenges
With all the available opportunities, there are also challenges that spreadsheets will face in the future. One of these challenges is data security. With the transfer of data to the cloud and the use of spreadsheets as online analytical tools, the need for special attention to data security and privacy will increase. In this regard, spreadsheets must implement advanced security features such as encryption and two-factor authentication to prevent unauthorized access to data.
Top Spreadsheet Software for Use in Financial Markets
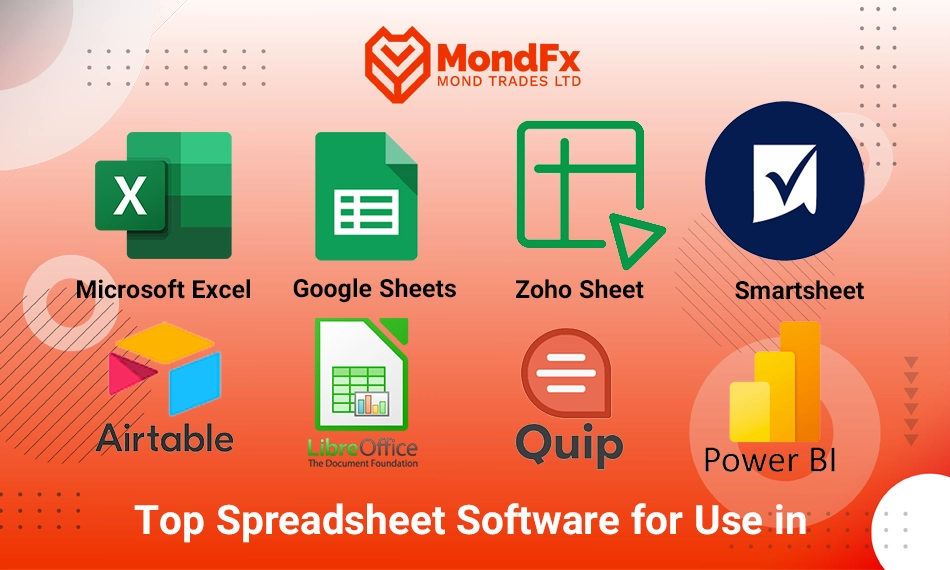
In financial markets, analytical and computational tools are of particular importance. Spreadsheets, as one of the primary tools for analyzing financial data, can help analysts and investors process and analyze information more accurately and quickly. In this section, we will introduce the top spreadsheet software that is suitable for use in financial markets.
1.Microsoft Excel
Microsoft Excel is one of the most well-known and widely used spreadsheet software programs in financial markets. Excel has numerous features that make it a suitable tool for financial analysis. This software supports complex functions, graphical charts, financial models, and advanced analytical tools. Additionally, Excel allows the creation of financial models and portfolio evaluation, which is very useful in both technical and fundamental market analysis. With Excel, users can easily input data, analyze it, and generate complex financial reports.
2.Google Sheets
Google Sheets is a free online software that allows users to work on data simultaneously with others. This software is particularly useful in team and organizational environments. Google Sheets has similar capabilities to Excel and is especially useful for analyzing financial data, reporting, and performing various simulations. Features like online access, real-time collaboration, and cloud storage make Google Sheets a suitable tool for use in financial analysis and managing market data.
3.Zoho Sheet
Zoho Sheet is another online spreadsheet software that is especially popular in organizations and large teams within financial markets. This software offers similar features to Google Sheets but has specific features for organizations and teams, including real-time collaboration, higher security, and integration with other Zoho tools such as Zoho CRM and Zoho Analytics. Zoho Sheet is an excellent option for professional users who need advanced tools.
4.Smartsheet
Smartsheet is an online spreadsheet software specifically designed for project management and data analysis. This tool allows users to input data simultaneously and analyze it in a tabular format. Additionally, Smartsheet is suitable for use in financial project management, risk assessment, and financial analysis. Key features of Smartsheet include team collaboration, tracking project timelines, and generating comprehensive financial reports.
5.Airtable
Airtable is an advanced online spreadsheet software used for data analysis across various industries, including financial markets. In addition to basic spreadsheet features, it offers additional capabilities like databases, graphs, and complex data views. Airtable is particularly useful for building financial models, business analysis, and creating analytical dashboards. This tool is especially beneficial for teams that need to analyze financial data in an organized manner.
6.LibreOffice Calc
LibreOffice Calc is a free spreadsheet software known as an alternative to Microsoft Excel. This software offers similar features to Excel and is suitable for performing complex calculations and financial analyses. Since LibreOffice Calc is open-source software, users can download it for free and use it for financial analysis. It is a great option for those who want a powerful tool for analyzing financial data but do not want to pay for commercial software.
7.Quip
Quip is an online collaboration tool that is especially useful for teams and organizations. This software allows users to input their financial data and work on it in real-time. Quip provides advanced tools for data analysis and supports spreadsheet features like mathematical functions, charts, and data models. Additionally, Quip integrates with other business tools such as Salesforce, helping users manage their financial data within a comprehensive platform.
8.Microsoft Power BI
Microsoft Power BI is a data analysis tool specifically designed for businesses and organizations. This software uses spreadsheets to create analytical dashboards and financial reports and directly integrates with various data sources, including spreadsheets, databases, and cloud services. With Power BI, users can more effectively analyze their financial data and generate accurate reports that aid in financial decision-making.