
One of the basic yet vital skills for technical analysis is the ability to move and manage charts on the trading platform. In MetaTrader 5, charts are the primary tool for observing price behavior and analyzing trends, and moving them effectively can significantly improve your trading experience. Moving a chart does not simply mean dragging the price image; it also includes quick access to key points, observing price patterns, and adjusting the analytical view based on different timeframes.
A proper understanding of chart navigation methods from using the mouse and keyboard shortcuts to setting automatic scrolling and changing timeframes helps you maintain greater focus on trends and trading opportunities. This simple yet essential skill provides a foundation for more accurate analysis and faster decision making in financial markets, while preventing wasted time in chart management. Join us at MondFx as we explain why this topic matters and how to perform this action in MetaTrader 5.
Why Is Chart Movement in MetaTrader Important?
Moving charts in MetaTrader allows you to view different parts of the chart and easily focus on various data points. This feature is especially useful when you want to review price history, navigate to specific areas of the chart, or analyze the market across different timeframes.
Types of Price Charts in MetaTrader
MetaTrader is one of the well known platforms for technical analysis and trading in financial markets. One of the important features of this platform is the ability to display different types of price charts, which help analysts accurately analyze market trends. Therefore, before performing any analysis, we must become well familiar with the symbols and basic elements and understand them properly.
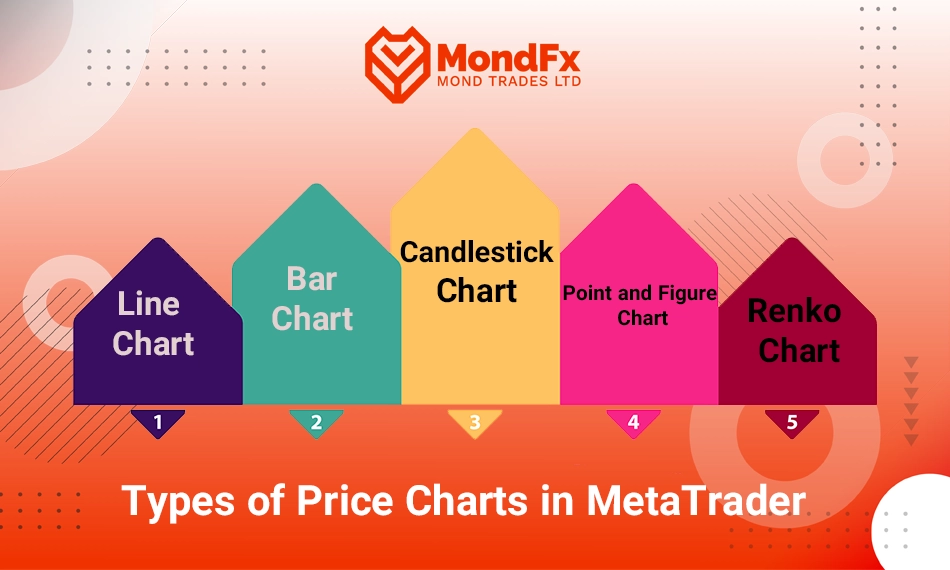
1. Line Chart
The line chart is the simplest type of price chart, in which only the closing price (Close) of each time period (timeframe) is displayed. In this chart, closing prices are shown as points connected to each other by a single line. This type of chart is mostly used to analyze the overall market trend and identify major patterns, and it does not show detailed information about price fluctuations during the time period. The line chart is useful for traders and analysts who are looking to observe the general direction of the market.
2. Bar Chart
The bar chart is one of the most common types of price charts and provides more information compared to the line chart. In this type of chart, a bar is drawn for each time period, displaying four different prices: the opening price (Open), the highest price (High), the lowest price (Low), and the closing price (Close). This chart allows analysts to observe market volatility and price movement during a time period more precisely. The bar chart is suitable for identifying price patterns and conducting more detailed market analysis.
3. Candlestick Chart
The candlestick chart is one of the most widely used types of price charts employed by technical traders. This chart consists of candles that display information similar to a bar chart, but in a different visual format. Each candle represents four prices: the opening price (Open), the highest price (High), the lowest price (Low), and the closing price (Close). The main difference between a candlestick chart and a bar chart is that in a candlestick chart, the filled or solid parts (known as the candle body) indicate the difference between the opening and closing prices, while the shadows (or wicks) represent the highest and lowest prices within the specified time period.
The candlestick chart is particularly popular due to its clear appearance and ease of identifying candlestick patterns. By using candlestick patterns, analysts can quickly recognize market trends and make appropriate trading decisions.
4. Renko Chart
The Renko chart is one of the types of price charts that is constructed solely based on price movement, without considering time. In this chart, square blocks in different colors are drawn, each representing a specific price change. When the price moves beyond a defined level, a new block is added. This type of chart is mainly used to identify market trends and filter out short term noise. Renko charts usually help traders identify strong trends and avoid incorrect trades.
5. Point and Figure Chart
The Point and Figure chart is another type of chart in which time plays no role and only price movements are taken into consideration. In this chart, price movements are displayed in the form of columns of Xs and Os. Each X represents a price increase, and each O represents a price decrease. This chart is mainly used for analyzing long term trends and identifying strong support and resistance levels. Analysts consider this type of chart useful for examining market conditions, especially during periods when there is less noise in the data.
How to Move the Chart in MetaTrader
MetaTrader is one of the popular technical analysis tools that allows traders to view various price charts and perform their analyses. One of the essential features of this software is chart movement, which helps you access different parts of the chart and review price history.
Using the Mouse to Move the Chart
The simplest and most common method for moving a chart in MetaTrader is using the mouse. To do this, simply place the mouse cursor on any point of the chart, left click and hold it. Then you can move the chart to the left or right. This method allows you to view different parts of the chart and examine various information such as price trends and opening and closing points in different sections of market history.
Using Keyboard Keys to Move the Chart
In MetaTrader, you can also use keyboard keys to move the chart. This method is especially useful when you want to move the chart more quickly or have greater precision in navigation. By using the up and down arrow keys, you can move the chart upward or downward, which is particularly efficient when you want to access the upper or lower sections of the chart. In addition, by using the left and right arrow keys, you can move the chart horizontally and view different time segments of the market.
Using the Drag and Drop Feature
Another method for moving a chart in MetaTrader is using the drag and drop feature. To do this, simply place the mouse cursor on the chart, left click and hold it. Then you can drag the chart in your desired direction and release the mouse after moving it. This method allows you to move the chart freely and easily view specific parts of it that you need for analysis.
Zooming in on the Chart for More Precise Navigation
In some cases, you may want to view a specific part of the chart in greater detail. For this purpose, you can use the zoom feature in MetaTrader. This feature allows you to enlarge the chart and examine specific parts of market trends with greater accuracy. To zoom in, you can use the zoom (+) and (-) tools in the upper corner of the chart, or use the mouse scroll wheel to zoom in or out. This method is especially useful when you want to examine minor market fluctuations or rapid price changes.
Chart Movement Settings in MetaTrader
MetaTrader is one of the most widely used software platforms in technical analysis and is a very useful tool for traders and analysts in financial markets. One of the important features of this software is the ability to move and view charts more easily. In MetaTrader, there are various settings for chart movement that help you analyze market trends more accurately and conveniently. In this article, different chart movement settings in MetaTrader and how to use them are discussed.
Setting Automatic Chart Scrolling
One of the important settings available in MetaTrader is automatic chart scrolling. This setting allows the chart to automatically move to the most recent part of the data when you reopen the software or change the timeframe. This feature is especially useful when you frequently switch between different timeframes or return to the platform after several minutes or hours.
To enable automatic chart scrolling, first go to the“View”menu in the top toolbar of the software. Then select the“Auto Scroll”option and activate it. Once this option is enabled, whenever a new chart is opened or the timeframe is changed, the chart will automatically move to the latest data or price. This feature helps you stay informed about the most recent market changes and prevents the need for manual chart movement.
Other Chart Movement Settings
In addition to automatic chart scrolling, MetaTrader allows you to customize several chart features according to your preferences. For example, if you want all information to be displayed clearly and accurately when viewing the chart, you can enable the“Grid”feature. This feature provides guiding lines on the chart, making it easier to track price movement as well as entry and exit points.
Additionally, if you want to consistently shift your chart to specific positions, you can enable the“Chart Shift”option. This setting allows you to move the chart from the right or left side of the screen and create more space for displaying data.
Speed Up Navigation Using the Mouse Scroll Wheel
One of the common ways to move a chart in MetaTrader is by using the mouse scroll wheel. This feature allows you to quickly zoom in or zoom out on the chart and view different parts of it. By scrolling the mouse wheel up or down, you can easily zoom the chart and focus on specific areas of the market. This feature is especially useful when you want to examine a particular part of the price history in greater detail.
How to Close a Trade in MetaTrader Android?
Closing a trade in MetaTrader for Android users is one of the essential actions performed to manage positions and control risk. In this section of the article, the process of closing a trade in MetaTrader for Android is explained step by step.
Steps to Close a Trade in MetaTrader Android:
Entering the Trade Section
After opening the MetaTrader application on your Android phone, go to the“Trade”section, which is usually located at the bottom of the screen. In this section, you will see all of your open positions.
Selecting an Open Position
In the“Trade”section, all of your open trades are displayed. To close a trade, simply tap on the position you want to close. This action will open the trade details page.
Closing the Trade
After the trade details page opens, you will see a button labeled“Close”at the bottom of the screen. This button allows you to close your position. Tap on this button.
Confirming the Close Operation
After tapping the“Close”button, a window will appear showing the details related to closing the trade, including the current price, volume, and current profit or loss. At this stage, to confirm closing the position, you must press the“Close”button again.
Trade Completion
After confirming the trade closure, the system will automatically close your trade, and the resulting profit or loss will be recorded in your trading account. The position is now closed and can be viewed in the“History”section.
Tick Chart in MetaTrader
The tick chart is one of the types of price charts available in MetaTrader for analysts and traders. This chart is especially useful for those who are looking for more precise and faster analysis of price fluctuations. In this article, the method of working with the tick chart in MetaTrader will be explained comprehensively.
What Is a Tick Chart?
A tick chart is a chart that is plotted based on each tick or change in market price, rather than time. In this chart, every price change that occurs in the market is added as a new point on the chart. Unlike conventional charts that display prices based on time (for example, on 5 minute, 15 minute, or hourly timeframes), the tick chart is directly related to price movement and can clearly display rapid changes and short term market fluctuations.
How to View a Tick Chart in MetaTrader
To view a tick chart in MetaTrader, follow the steps below:
Opening a New Chart
First, in MetaTrader, go to the“File”menu and select the“New Chart”option to open a new chart.
Selecting a Currency Pair or Trading Symbol
Next, choose your desired currency pair or trading symbol from the list of symbols and add it to the new chart.
Selecting the Tick Chart
After the new chart opens, go to the“Chart Type”section in the top toolbar and select the“Tick Chart”option. By choosing this option, the chart will switch to tick chart mode and will display only price changes.
Features and Advantages of the Tick Chart
The tick chart offers many advantages that help analysts better understand market price fluctuations. These features include:
Accurate Display of Short Term Fluctuations
The tick chart can display small and rapid price fluctuations in the market more precisely. This feature is especially useful for traders who are looking for fast and short term trading opportunities.
Elimination of Time Based Noise
In a tick chart, price changes are displayed without considering time. This results in the removal of time based noise that may exist in conventional charts, making analyses more accurate and clearer.
Suitable for Scalpers and Short Term Traders
The tick chart is particularly suitable for scalpers and traders who seek trading opportunities in short term timeframes. This chart helps them identify small price fluctuations and take advantage of them.
Limitations and Challenges of the Tick Chart
Although the tick chart is a powerful tool, it also has limitations that should be taken into consideration:
Lack of Time Display
One of the drawbacks of the tick chart is that time plays no role in it. This means that you cannot observe the exact duration of price changes, which may not be useful for some traders.
Need for More Precise Analysis
Due to the detailed display of short term fluctuations, the tick chart requires more precise analysis. This can be challenging for beginner traders or those who are seeking long term analysis.
The tick chart in MetaTrader is a tool specifically designed for traders who seek precise analysis of price fluctuations and entry into short term trades. This chart is particularly useful for scalpers and those who operate in short term timeframes. However, it should be noted that the tick chart cannot completely replace other conventional charts and is best used alongside other analytical tools.
Ruler Tool in MetaTrader
The ruler is one of the useful tools in the MetaTrader software that allows analysts and traders to measure the distance or range between two specific points on a chart. This tool is especially useful for more precise analysis of price movements and for calculating price changes across different timeframes. In this article, the method of using the ruler tool in MetaTrader will be explained.
How to Use the Ruler Tool in MetaTrader?
To use the ruler tool in MetaTrader, you must first activate it on your platform. Follow the steps below:
Opening the Chart
First, log in to the MetaTrader software and open the chart of your desired currency pair or trading symbol.
Selecting the Ruler Tool
In the top toolbar, go to the“Insert”section. Then, from the opened menu, select“Objects”and find the“Ruler”option. By selecting this option, the ruler cursor will appear on the chart.
Drawing the Ruler on the Chart
To measure the distance between two points, simply move your mouse to the starting point and click, then move the mouse toward the ending point and release the click. After doing this, a ruler will be drawn on your chart, showing the price and time distance between the two points.
Viewing the Result
After placing the ruler on the chart, MetaTrader will automatically display the distance between the two points in terms of price and time units. You can view this information alongside the chart and use it for more precise analysis.
Features of the Ruler Tool
The ruler tool in MetaTrader has various features that help analysts examine the market more accurately. These features include:
Displaying Price and Time Distance
The ruler in MetaTrader can display two types of distance: price distance (which indicates the price change between two points) and time distance (which shows the duration between two points). This feature is very useful for analyzing market movement over time and evaluating price changes, especially across different timeframes.
Suitable for Measuring Price Volatility
This tool helps you accurately measure price volatility and observe the magnitude of price changes over a specific period of time. This information can assist you in evaluating the strength of market trends and determining support and resistance levels.
Measuring Price Movement Across Different Timeframes
One of the advantages of using the ruler tool is that you can measure both price and time distance across different timeframes. For example, in short term timeframes, you can measure rapid price fluctuations, while in long term timeframes, you can analyze larger market movements.
Applications of the Ruler Tool in Market Analysis
Using the ruler tool in MetaTrader allows analysts to:
Measuring Price Movement in Trends
By using the ruler tool, you can measure price movements within an uptrend or downtrend and analyze whether the price movement is sufficiently large and significant.
Determining the Distance Between Support and Resistance Levels
The ruler tool helps you measure the distance between support and resistance levels and assess how far the price may move away from these levels. This information can assist you in determining price targets and entry and exit points.
Examining the Degree of Price Volatility
By measuring price changes over different time periods, you can evaluate market volatility and adjust your trading decisions accordingly.
The ruler tool in MetaTrader is a practical and useful instrument for analysts, helping them accurately measure price and time distance and perform more precise analyses. By using this tool, you can measure price volatility, trend movements, the distance between support and resistance levels, and other market characteristics, and adjust your trading decisions based on these measurements.
Conclusion
Moving charts in MetaTrader 5 is one of the fundamental and essential skills for accurate analysis of financial markets. This capability allows traders to access different parts of the chart, better understand trends and price fluctuations, and perform more precise analyses.
There are various methods for moving charts, including using the mouse, keyboard keys, drag and drop functionality, and zooming the chart. In addition, automatic settings such as Auto Scroll and Chart Shift enable users to display charts automatically or with their preferred spacing, thereby increasing focus on analysis.
Complementary tools such as the tick chart and the ruler tool also make it easier to analyze price fluctuations accurately and measure price and time distances. Overall, learning and mastering these features provides a foundation for faster and more successful trading decisions and better chart management.
If you are looking to start a reliable path in the world of financial markets, collaborating with the MondFx team can be a good starting point for building your personal trading strategy.
Frequently Asked Questions
How can charts be moved in MetaTrader 5?
To move a chart in MetaTrader 5, you can use the mouse. Simply place the mouse cursor on the chart, hold down the left mouse button, and move the chart to the left or right. You can also use the arrow keys to move the chart horizontally and vertically, or use the drag and drop feature to move the chart freely.
Can chart movement be automated?
Yes, MetaTrader allows you to enable the Auto Scroll option. By activating this feature, the chart automatically moves to the latest data and prices, eliminating the need for constant manual chart movement. This feature is especially useful when you use different timeframes or return to the platform after a period of time.
How can a specific part of the chart be examined more precisely?
To view a specific part of the chart more accurately, you can use the zoom feature. By zooming in on the chart using the + and − tools or the mouse scroll wheel, you can better observe trend details and short term price fluctuations and perform more precise analysis.
What Is a Tick Chart and What Is It Used For?
A tick chart is a chart that is plotted based on each price change (tick), with time playing no role in its formation. This chart displays small and rapid market fluctuations more accurately and is very useful for scalpers and short term traders who need fast analysis of price changes.
What Is the Ruler Tool in MetaTrader Used For?
The ruler tool allows you to measure the price and time distance between two points on the chart. This tool is very useful for analyzing price movement within trends, identifying support and resistance levels, and measuring volatility across different timeframes, enabling more precise market analysis.