The ability to analyze and predict price movements accurately is a vital advantage for traders. Among various methods, trading strategies based on candlestick patterns hold a special place as one of the oldest yet most effective technical analysis techniques. These patterns, rooted in Japanese trading traditions, offer a unique language for reading market sentiments through a combination of mathematical precision and psychological insight. In this article, we will explore these strategies in depth, examine their application in different market conditions, and discuss how to combine them with other analytical tools to achieve better results.
Definition and History of Candlestick Patterns
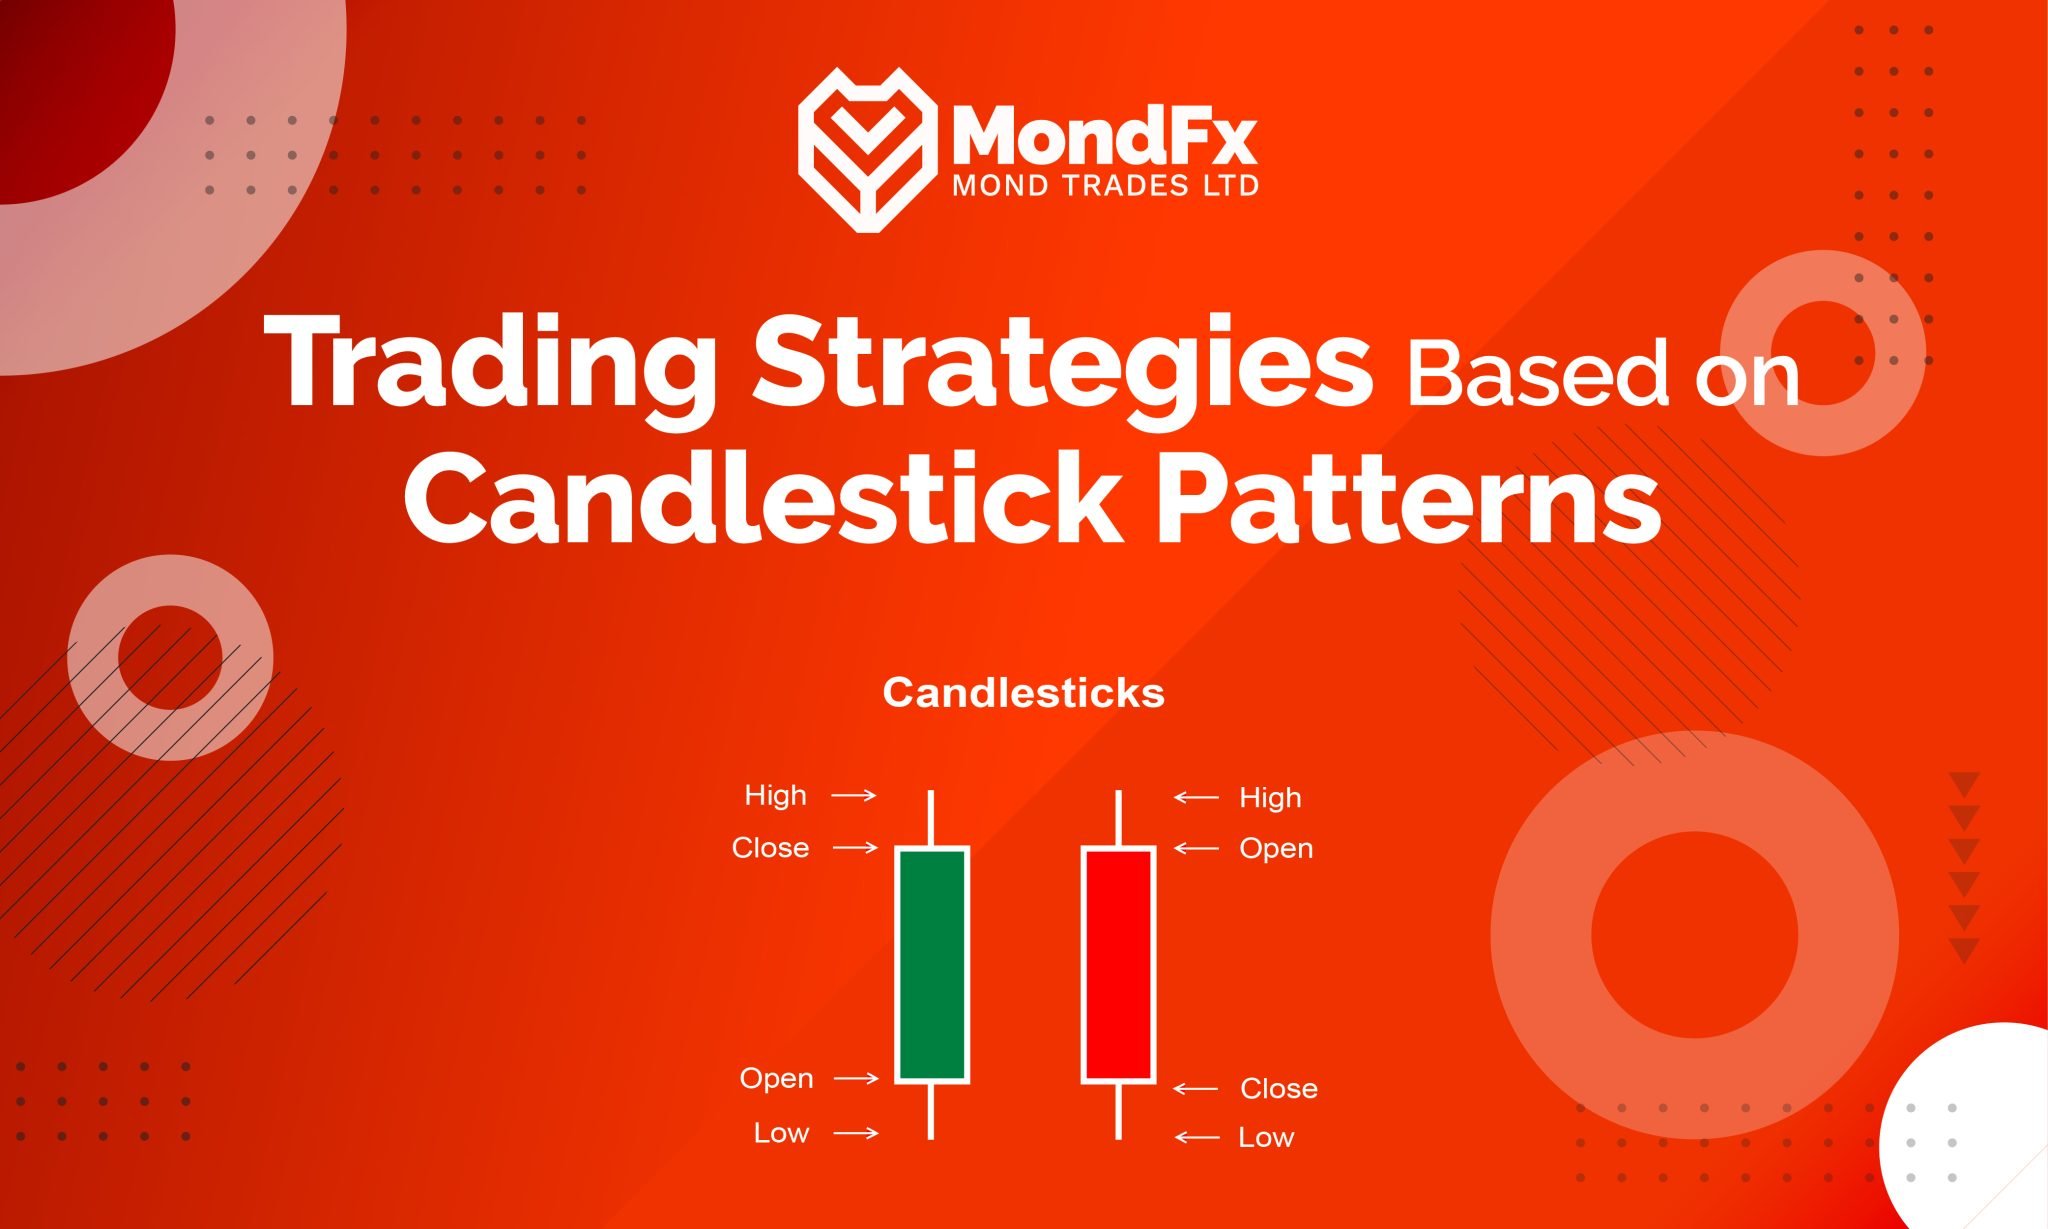
Candlestick patterns are an important tool in technical analysis used to represent price movement in financial markets. Each candlestick consists of four main components: the opening price, closing price, highest price, and lowest price within a specified time period. These patterns are displayed using the body (the filled part) and the shadows (the thin lines above and below the body). The color of the body, typically green or red, indicates a price increase or decrease.
The history of candlesticks dates back to the 18th century in Japan.
They were first utilized by a rice trader named "Homma," who sought to predict market trends by analyzing rice price fluctuations. This method was introduced to the West in the late 1990s and quickly became one of the favored tools among financial analysts.
The Importance of Using Candlesticks in Technical Analysis
Candlesticks are considered a highly useful tool in technical analysis due to their ability to provide comprehensive and visual information. They enable analysts to quickly grasp market changes and identify potential trends. The most significant advantage of candlesticks is that they not only display prices but also reflect market sentiments and psychology. For example, a candlestick with a long lower shadow may indicate sellers' efforts to push prices down, while simultaneously showing strong support from buyers.
Candlestick patterns can assist in identifying suitable entry and exit points. Patterns such as Doji, Hammer, and Engulfing can signal trend reversals or continuations. This feature helps traders make more accurate decisions and manage trading risks more effectively.
Other Advantages of Candlesticks
One of the other benefits of candlesticks is their ability to be combined with other technical analysis tools, such as moving averages and Relative Strength Index (RSI). This integration provides traders with a more comprehensive view of the market and enhances the accuracy of their analyses.
Ultimately, candlesticks serve as a powerful tool in technical analysis, helping traders make better trading decisions through a deeper understanding of market movements. This tool is not only valuable for professionals but also for beginners, as it is easy to understand and apply. By utilizing candlesticks, traders can achieve increased profits and reduced risks in their trades.
Components of a Candlestick
Body:
The body of a candlestick is the main filled part that represents the difference between the opening and closing prices within a specific time period. If the closing price is higher than the opening price, the body is typically green or white, indicating a price increase during that period. Conversely, if the closing price is lower than the opening price, the body will be red or black, signaling a price decrease. The size of the body also provides important information; a long body indicates strong buying or selling pressure, while a short body may suggest indecision in the market.
Shadows (Upper and Lower):Candlestick shadows are thin lines that extend above and below the body, indicating the price range fluctuations during the period. The upper shadow represents the distance between the highest price and the body of the candlestick, while the lower shadow shows the distance between the lowest price and the body. Long shadows can indicate significant market volatility and may alert traders to potential price reversal points. For instance, a long lower shadow may suggest that buyers have taken control by the end of the period.
The Color of Candlesticks and Its Meaning:The color of a candlestick provides important information about market trends. As mentioned, a green or white candlestick indicates that the price has increased during that period, reflecting stronger buying pressure. On the other hand, a red or black candlestick signifies a price decrease, indicating greater selling pressure. The color of the candlestick helps traders quickly assess the overall market condition and adjust their trading decisions accordingly.
Combined Analysis of Components Combining these components allows traders to identify stronger signals. For example, a candlestick with a long body and short shadows may indicate a strong trend, while a candlestick with long shadows and a short body might suggest indecision or a potential market reversal. By observing changes in the body and shadows, analysts can better identify entry and exit points, thereby reducing trading risks.
Understanding the components of a candlestick aids traders in conducting more effective technical analysis and making better trading decisions. With the information provided by the body, shadows, and color of the candlestick, traders can quickly evaluate market conditions and adjust their strategies accordingly. This ability to analyze and utilize candlesticks can distinguish a successful trader from an unsuccessful one. Therefore, studying and becoming familiar with this powerful tool is essential for every trader.
Types of Candlestick Patterns
Bullish Patterns
Bullish patterns indicate the likelihood of price increases in the future and provide traders with buy signals. These patterns typically appear at the end of a downtrend and signify a market reversal upward. Some of the most important bullish patterns include:Hammer:This pattern features a small body at the top and a long lower shadow. It indicates that sellers initially pushed the price down, but buyers eventually took control and drove the price up.Bullish Engulfing:This pattern consists of two candlesticks, where the second candlestick completely engulfs the body of the first. The first candlestick is bearish, while the second is bullish, signaling a shift in power from sellers to buyers.Morning Star:This pattern includes three candlesticks: a long bearish candlestick, a small-bodied candlestick, and a long bullish candlestick. This combination signifies a reversal from downward to upward movement.Bearish Patterns:Bearish patterns indicate the likelihood of price decreases in the future and provide traders with sell signals. These patterns typically appear at the end of an uptrend and signify the beginning of a downward price trend.
Some examples of bearish patterns include:Hanging Man:This pattern is similar to the Hammer but appears at the end of an uptrend. The long lower shadow indicates significant selling pressure, although buyers were able to push the price up.Bearish Engulfing:In this pattern, the second candlestick is bearish and completely engulfs the body of the first bullish candlestick. This pattern signifies a shift in power from buyers to sellers.Evening Star:Similar to the Morning Star, this pattern also consists of three candlesticks: a long bullish candlestick, a small-bodied candlestick, and a long bearish candlestick. This combination indicates a reversal from upward to downward movement.Indecision Patterns Indecision patterns indicate uncertainty in the market and usually signify a pause or trend change. These patterns often form when buyers and sellers are evenly matched in strength.
Some examples of indecision patterns include:Doji:This pattern occurs when the opening and closing prices are nearly equal. A Doji indicates indecision in the market and may suggest a potential trend change or continuation.Spinning Top:This pattern features a small body with long shadows above and below. It reflects hesitation in the market and a lack of dominance for either buyers or sellers.Four Price Doji:This is the rarest type of Doji, where the opening, high, low, and closing prices are all the same, indicating complete inactivity in the market.
Recognizing various candlestick patterns enables traders to predict market movements more accurately and make better trading decisions. Bullish and bearish patterns assist in identifying entry and exit points, while indecision patterns can signal potential trend changes. Combining these patterns with other technical analysis tools can enhance the accuracy of analyses and success in trading.
Common Candlestick Patterns
Doji
A Doji forms when the opening and closing prices are the same or very close to each other. This pattern indicates indecision in the market, where buyers and sellers have nearly equal power. A Doji alone cannot determine market direction, but when it appears alongside other patterns or at key chart points, it may suggest a potential trend change. Different types of Doji include the Gravestone Doji, Dragonfly Doji, and Long-legged Doji, each carrying distinct meanings in their specific contexts.Hammer and Hanging Man Hammer and Hanging Man patterns are quite similar but appear at different points in a trend and carry different meanings.Hammer:This pattern occurs at the end of a downtrend and suggests a potential price reversal upward. The Hammer features a small body at the top and a long lower shadow, indicating that although sellers pushed the price down, buyers managed to regain control and push the price back up.
Hanging Man:This pattern appears at the end of an uptrend and can serve as a warning of a potential price reversal downward. Its structure is similar to that of the Hammer, but it indicates that selling pressure is increasing, suggesting that the upward trend may be nearing its end.
Engulfing Patterns Engulfing patterns consist of two candlesticks and can be either bullish or bearish.Bullish Engulfing:This pattern occurs when a large bullish candlestick completely engulfs a smaller bearish candlestick. It typically appears at the end of a downtrend, indicating that buyers are gaining strength and suggesting a potential reversal of the trend upward.
Bearish Engulfing:In contrast to the bullish engulfing pattern, this occurs when a large bearish candlestick engulfs a smaller bullish candlestick. This pattern appears at the end of an uptrend, indicating that sellers are gaining strength and suggesting a potential price decline.
Harami Patterns
The term "Harami" means "pregnant" in Japanese and consists of two candlesticks, one large and one small, which is contained within the body of the first.Bullish Harami:This pattern appears at the end of a downtrend and includes a large bearish candlestick followed by a smaller bullish candlestick that is completely within the body of the first. This pattern indicates a reduction in selling pressure and a potential increase in price.
Bearish Harami:In contrast to the bullish harami, this pattern appears at the end of an uptrend and consists of a large bullish candlestick followed by a smaller bearish candlestick within the body of the first. This pattern indicates a reduction in buying pressure and a potential decrease in price.
These patterns help traders identify better entry and exit points, allowing for more informed trading decisions through careful market analysis. Using these patterns alongside other technical analysis tools can enhance accuracy and success in trading.Candlestick-Based Trading Strategies
Identifying Entry and Exit Points Utilizing candlestick patterns is an effective method for identifying entry and exit points in trades. Traders can spot suitable market entry points by observing specific patterns, such as the Hammer or Bullish Engulfing. For instance, the appearance of a Hammer pattern at the end of a downtrend may indicate a market reversal upward, making it a potential entry point. Similarly, a Hanging Man pattern at the end of an uptrend can serve as a signal to exit the market. These patterns help traders make more confident decisions and reduce their trading risks.Confirming Support and Resistance Levels Candlesticks can assist in confirming support and resistance levels. These levels are points where the price may stall or reverse. When a strong candlestick pattern, like a Doji or Bearish Engulfing, appears near these levels, it can affirm the strength of that level. For example, if a Bullish Engulfing pattern forms near a support level, it may suggest that the support is strong, and the price is likely to move upward. This information helps traders determine more precise entry and exit points and avoid sudden price changes.Combining with Other Technical Indicators
To enhance the accuracy and effectiveness of analyses, candlestick patterns are often combined with other technical indicators. Utilizing moving averages, the Relative Strength Index (RSI), and the Moving Average Convergence Divergence (MACD) alongside candlesticks can provide stronger signals for trading decisions. For example, if a Bullish Engulfing pattern occurs simultaneously with the price crossing above a moving average, it is likely to be a stronger buy signal. Similarly, combining candlestick patterns with indicators like the RSI can help better identify overbought or oversold conditions, leading to more precise decisions.Practical Application in Trading
Traders should remember that no trading strategy can guarantee success on its own. Therefore, using candlestick patterns should be viewed as part of a comprehensive trading strategy. This strategy should include risk management, price target determination, and the use of management tools such as stop-loss orders. Additionally, traders must continuously monitor the market and be ready to adjust their strategies in response to changing market conditions.
In conclusion, traders must remember that financial markets are dynamic and volatile, with no guarantees of success. Therefore, continuous education and practice in simulated environments can help traders improve their skills and make better decisions in real market conditions.
Utilizing these strategies can assist traders in analyzing the market with greater accuracy and making more informed trading decisions. By combining candlestick patterns with other technical analysis tools, traders can achieve better results and reduce their trading risks.Advantages and Disadvantages of Using Candlestick Patterns in Trading
Advantages Candlestick patterns are one of the most popular tools in technical analysis among traders due to their simplicity and clarity in presenting information. These patterns are easily recognizable and visually display important information such as opening and closing prices, as well as the highest and lowest prices. These features help traders quickly assess the market situation and make appropriate trading decisions.
Another advantage of candlestick patterns is their ability to identify trends and potential changes in the market. For example, patterns like the hammer and doji can indicate possible reversal points, which assists traders in determining entry and exit points. This capability is especially useful for beginner traders seeking to learn efficient market analysis quickly.
Additionally, candlestick patterns can be combined with other technical analysis tools, such as moving averages and relative strength indicators, to provide traders with a more comprehensive view of the market situation. These features enhance the accuracy of analyses and improve trading performance.Disadvantages Despite the mentioned advantages, the use of candlestick patterns is not without its drawbacks. One of the main challenges is the possibility of false signals. Just as markets can be highly volatile, candlestick patterns may sometimes provide signals that do not align with the actual market trend. This can lead to incorrect trading decisions and, consequently, financial losses.
Additionally, candlestick patterns alone cannot cover all aspects of the market and may not provide sufficient information for appropriate decision-making under specific conditions. For example, in highly volatile markets or those with low trading volumes, candlestick patterns may be less reliable.
Furthermore, misinterpreting patterns can lead to trading mistakes. Traders need to have a precise understanding of the characteristics and meanings of each pattern to use them correctly. This requires experience and ongoing practice.
To mitigate these disadvantages, traders should use candlestick patterns as part of a broader strategy, combining them with other technical and fundamental analysis tools. Additionally, employing proper risk management techniques, such as setting stop-loss orders, can help reduce potential losses.
Overall, candlestick patterns can be powerful tools in technical analysis, but to use them effectively, traders must carefully analyze them and integrate them with other tools. Continuous education and practice in various market conditions can also enhance traders' analytical abilities.Market Psychology and Its Impact on Candlestick Patterns
Analyzing Market Psychology Market psychology plays a crucial role in the formation of candlestick patterns. These patterns reflect the emotions and behaviors of traders within the market. Each candlestick tells a story about the battle between buyers and sellers during a specific time period. For example, a candlestick with a long body indicates strong sentiments in one direction, while a Doji represents indecision and uncertainty.Common Emotions in the Market
Trader emotions can quickly shift from fear to greed, and these changes are clearly visible in candlestick patterns. For instance, in a bearish market, fear can lead to rapid selling, resulting in the formation of bearish patterns. Conversely, in a bullish market, greed and optimism for rising prices can lead to increased buying activity and the emergence of bullish patterns.Impact of News and Events
Economic news and events can significantly influence market psychology and directly affect candlestick patterns. Traders' reactions to positive or negative news can cause sharp price fluctuations and the formation of diverse patterns. Therefore, traders should not only rely on technical analysis but also consider fundamental analysis and market news to better predict market reactions.
By understanding the psychological underpinnings of market movements, traders can enhance their ability to interpret candlestick patterns and make informed trading decisions.Managing Psychological Influences
For successful trading, managing psychological influences is crucial. Traders must be aware of their emotions and avoid making impulsive decisions. Implementing a structured trading strategy and adhering to it can help mitigate psychological effects.
Additionally, practicing focus and stress management can assist traders in maintaining their composure during critical market conditions, leading to more rational decisions. For instance, setting realistic goals and regularly reviewing trading performance can help traders learn from past mistakes and improve their skills.
By fostering self-awareness and discipline, traders can better navigate the emotional landscape of the markets and enhance their overall trading performance.Utilizing Psychology to Enhance Strategies
A deeper understanding of market psychology allows traders to refine their strategies. By recognizing common behavioral patterns among traders, one can identify market strengths and weaknesses and leverage this knowledge to optimize trades.
For instance, identifying periods when the market overreacts to news can help traders time their entries and exits more effectively. This approach not only enhances trading performance but also boosts traders' confidence.
Market psychology is a key factor in analyzing candlestick patterns and making trading decisions. By gaining insight into market sentiments and their impact on price patterns, traders can significantly improve their strategies and achieve greater success in their trades. Continuous learning and practice in this area provide powerful tools for success in financial markets.Conclusion and Recommendations
Importance of Combining Candlestick Analysis with Other Tools
While candlestick analysis can provide valuable insights into market movements, combining it with other technical analysis tools is essential for enhancing accuracy and effectiveness. Tools such as moving averages, the Relative Strength Index (RSI), and the Moving Average Convergence Divergence (MACD) can help confirm candlestick signals and offer better entry and exit points.
For example, if a bullish engulfing pattern coincides with price crossing a significant moving average, the likelihood of its success increases. Additionally, using indicators like RSI can aid in identifying overbought or oversold conditions, thereby improving trading decisions.
Combining these tools gives traders a more comprehensive view of market conditions, allowing for more confident decision-making. This integrated strategy can help reduce the chances of false signals, thereby minimizing trading risks.Tips for Risk and Capital Management
Risk and capital management is a crucial component of any successful trading strategy. Even with the best analyses and tools, the market can always move against predictions. Therefore, traders need to employ effective risk management methods.Setting Stop-Loss Orders: Always establish a stop-loss for every trade. This helps prevent significant losses if the market moves contrary to expectations.
Setting Take-Profit Levels: Similarly, determining a take-profit point allows you to secure your gains and avoid being driven by greed. This strategy helps you lock in profits at predetermined levels.
Position Sizing: Determine the size of your trades based on your overall capital and risk tolerance. A common rule is to risk only a small percentage of your total capital on a single trade.
Diversification: Avoid putting all your capital into a single trade or asset. Diversifying your investments across different assets can reduce risk.
Regularly Review and Adjust: Continuously monitor your trades and be willing to adjust your strategies based on market conditions and your performance.
By implementing these risk management practices, traders can better navigate market uncertainties and protect their capital over the long term.Diversification and Risk Management Tips
Diversification: Investing in only one asset or market can increase risk. By diversifying your investment portfolio, you can reduce overall risk.
Trade Size Management: Never invest more than you can afford to lose in a single trade. It’s generally recommended to risk no more than 1-2% of your total capital on each trade.
Adherence to Strategy: Stick to your trading strategy and avoid emotional decision-making. Planning and discipline in trading can contribute to long-term success.
Continuous Education and Practice: Markets are constantly changing, so ongoing learning and staying updated with the latest strategies and analytical tools can enhance trading performance.
By combining candlestick analysis with other technical tools and adhering to risk and capital management principles, traders can navigate financial markets with greater confidence and achieve better results. Focusing on these fundamentals allows traders to gradually improve their skills and move toward success in financial markets.Final Conclusion
Trading strategies based on candlestick patterns are powerful tools in the technical analysis of financial markets. These patterns provide comprehensive and visual information about price movements, helping traders better identify trends, reversal points, and support and resistance levels. However, to achieve optimal results, it is essential to combine these patterns with other technical analysis tools, along with a proper understanding of market psychology and risk management principles.
Continuous education, practice, and adherence to a cohesive strategy are key to successfully utilizing this analytical method. By doing so, traders can make better decisions and achieve more favorable outcomes in their trades.