

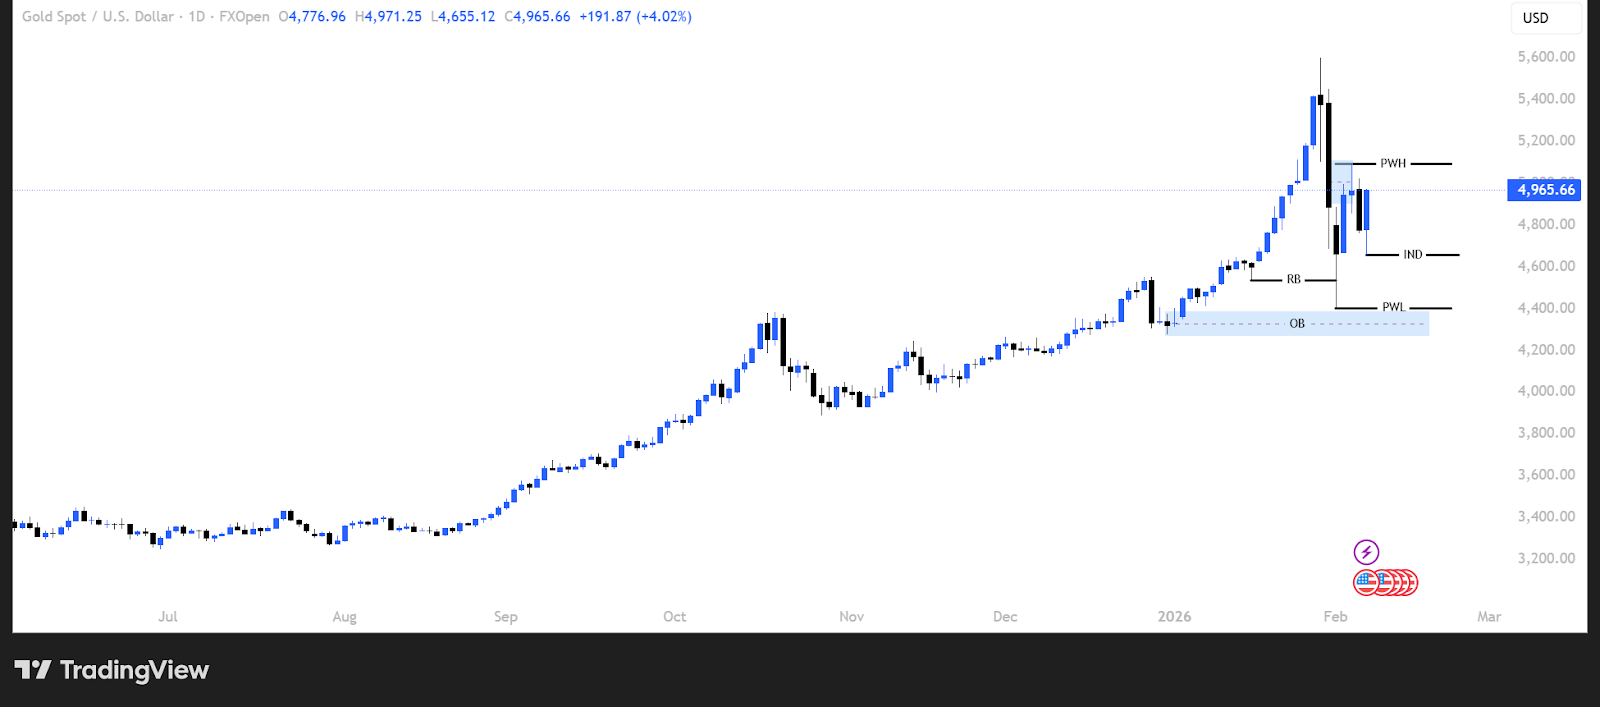
Gold slightly recovered from its previous sharp decline over the past week. After dropping to the 4,400 level on Monday, price encountered buying pressure and subsequently rallied to 5,080. Thereafter, price remained in a ranging move, which may indicate liquidity accumulation.
Daily Timeframe – (XAU/USD)
Gold slightly recovered from its previous sharp decline over the past week. After dropping to the 4,400 level on Monday, price encountered buying pressure and subsequently rallied to 5,080. Thereafter, price remained in a ranging move, which may indicate liquidity accumulation.
Primary Scenario (Higher Probability)
Considering price’s inability to break the order block zone and the strong rebound from this area, if price can establish itself above last week’s high (5,080), there is a possibility of a renewed rise toward the 5,500 level.
Key Price Levels:
Last week’s high: 5,080
Institutional Demand Zone (IND): 4,655
Alternative Scenario (Lower Probability)
If, through the accumulation of selling pressure, price manages to break below the 4,655 institutional demand zone, a renewed decline toward the market order block area around 4,400 becomes likely.
In this scenario, after liquidity accumulates above last week’s high, price may experience a significant reversal.
Key Price Levels:
Institutional Demand Zone (IND): 4,655
Order Block Range: 4,275 – 4,375
1 Hour Timeframe
1 Hour Timeframe – Gold Spot (XAU/USD)
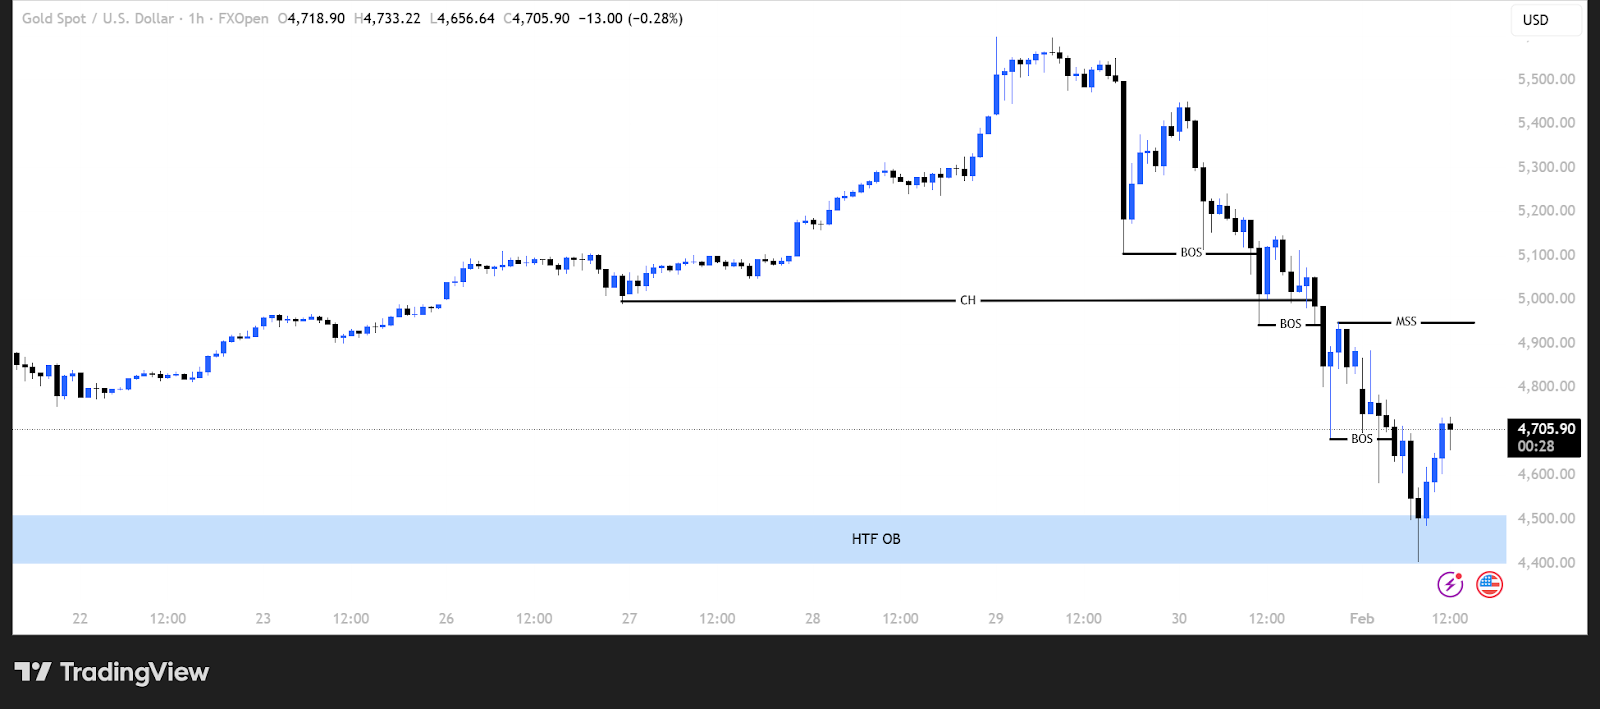
Gold continued its bearish trend over the past week and, after reacting to the higher timeframe order block at the 4,400 level, faced increased demand and advanced to 5,080. Price then entered a ranging structure and, after tapping the FVG, once again settled around the 5,000 level.
Primary Scenario (Higher Probability)
Considering that price has formed a higher low, if it manages to break above the order block zone in the 5,000–5,080 range, there is a possibility of a price advance toward the 5,451 level.
Key Price Levels:
Buy Zone (Liquidity): 5,400
Bullish Target: 5,451
Alternative Scenario (Lower Probability)
If price fails to establish itself above the 5,000 level and comes under selling pressure, there is a possibility of a decline toward the key price zones.
Key Price Levels:
Fair Value Gap (FVG): 4,689 – 4,767
Price Order Block Zone (HTF OB): 4,498 – 4,400
Sell Side Liquidity: 4,400