
Technical Analysis of Brent Oil (Daily Timeframe)
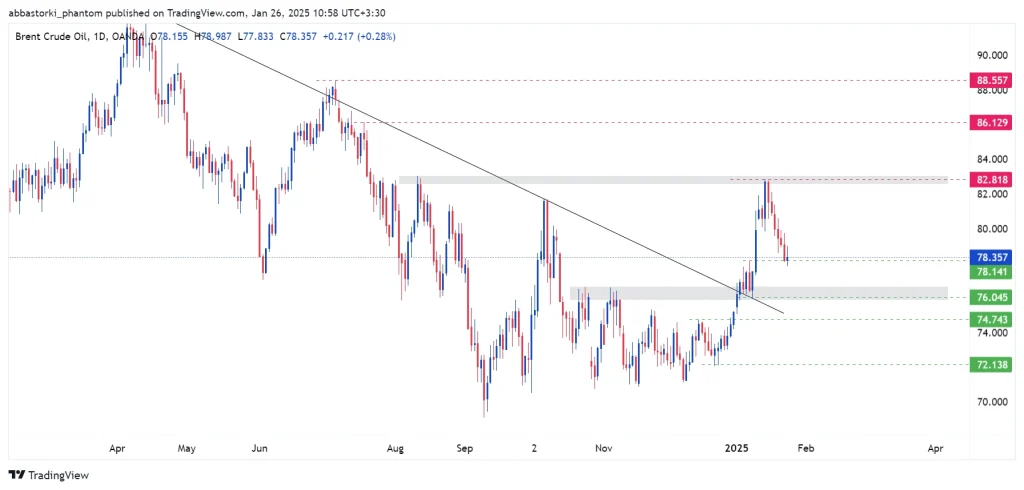
Brent oil, after reaching the critical level of $82.818, started a correction last week and reached the significant level of $78.141 on the last trading day. It is likely that this week, it will complete its pullback.
- Primary Scenario: Brent oil may complete its pullback from the current level of $78.141 or $76.045 and move towards the resistance levels of $82.818 and then $86.129.
- Alternative Scenario: If sellers dominate the market significantly and the $76.045 level is broken, the next support at $74.743 could serve as a potential reversal point. However, if this level is also breached, the next target for the price would be $72.138.
Technical Analysis of Brent Oil (4H Timeframe)
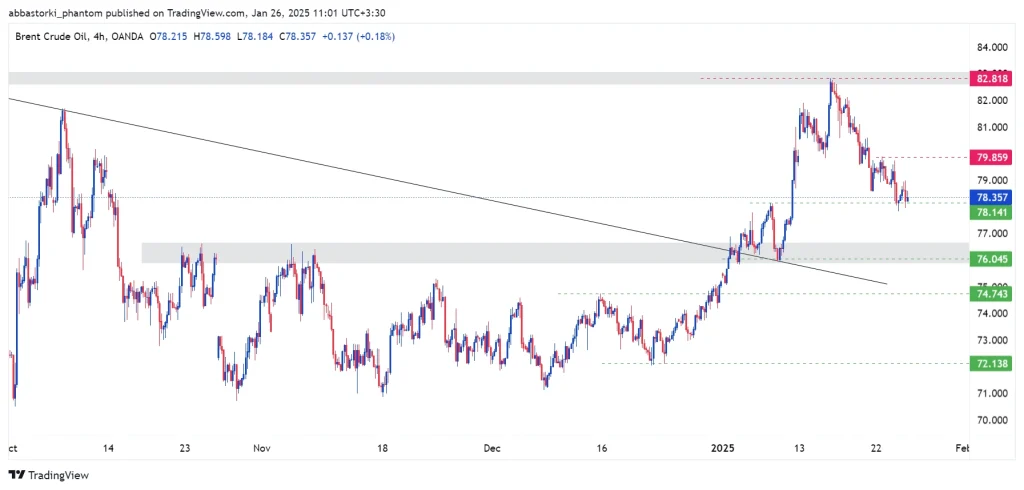
- Primary Scenario: If Brent oil breaks and consolidates above the $79.859 resistance level, the next target would be the $82.828 resistance level.
- Alternative Scenario: If the price breaks below the $78.141 support level, the next targets would be $76.045 and potentially $74.743.
Technical Analysis of Brent Oil (15-Minute Timeframe)
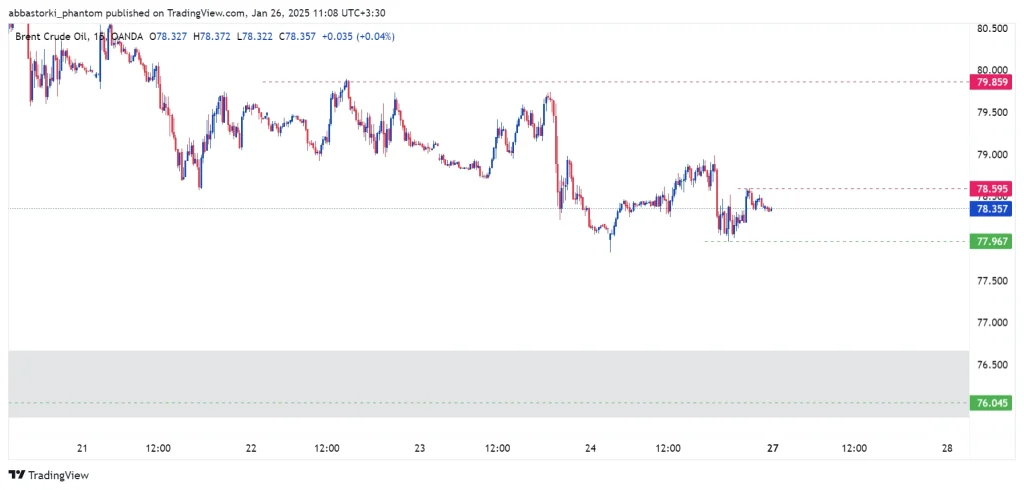
- Primary Scenario: If the price moves upward and breaks the $78.595 resistance level, the next target would be around $79.859.
- Alternative Scenario: If the price breaks below the $77.967 support level, the next target would be around $76.045.