
Technical Analysis of Brent Oil (Daily Timeframe)
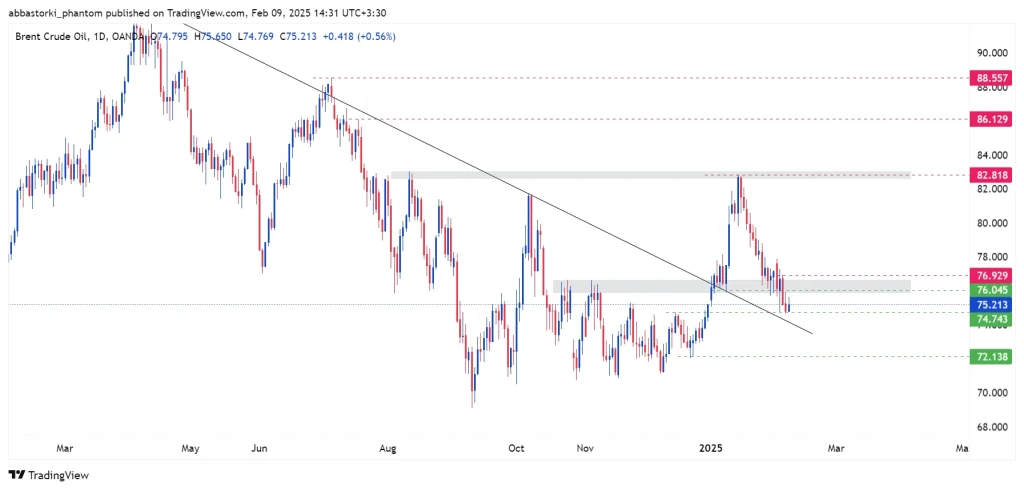
Technical Analysis of Brent Crude Oil (Daily Timeframe)
In the past week, Brent crude oil failed to maintain support at the critical level of $76.045 and moved toward lower levels, reaching the previously mentioned zone at $74.743. Given the sharp decline, the key question is whether the price can find support at this level and rebound upwards.
- Main Scenario: If Brent crude finds support at the current level of $74.743 and reverses upwards, breaking above $76.929, it could target its last peak at $82.818.
- Alternative Scenario: If this support fails and the price breaks below, the next target would be the $72.138 level.
Technical Analysis of Brent Oil (4H Timeframe)
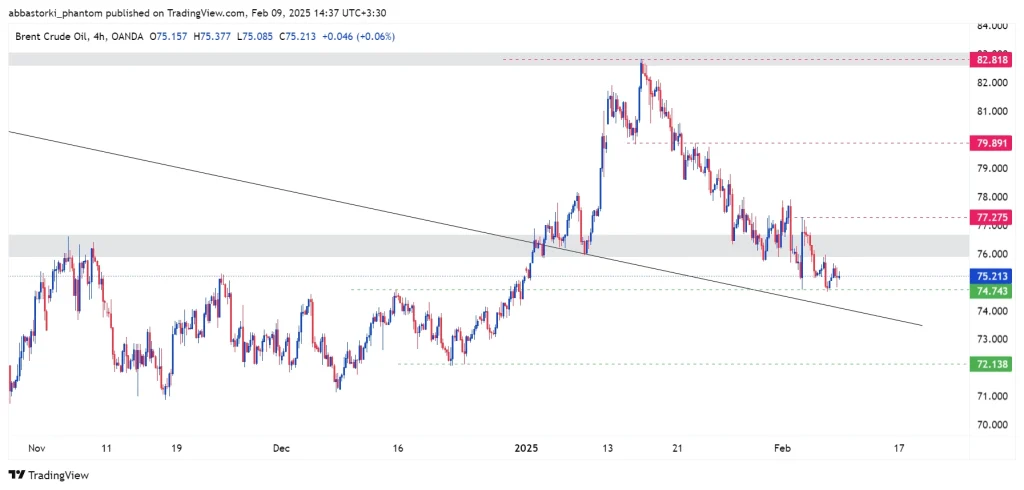
- Main Scenario: Brent crude is expected to complete its pullback to the broken trendline after finding support at $74.743. If it successfully breaks and stabilizes above $77.275, the price could move towards the $79.891 and $82.818 levels.
- Alternative Scenario: If the price fails to hold at $74.743 and breaks below, the next support area at $72.138 will come into play.
Technical Analysis of Brent Oil (15-Minute Timeframe)
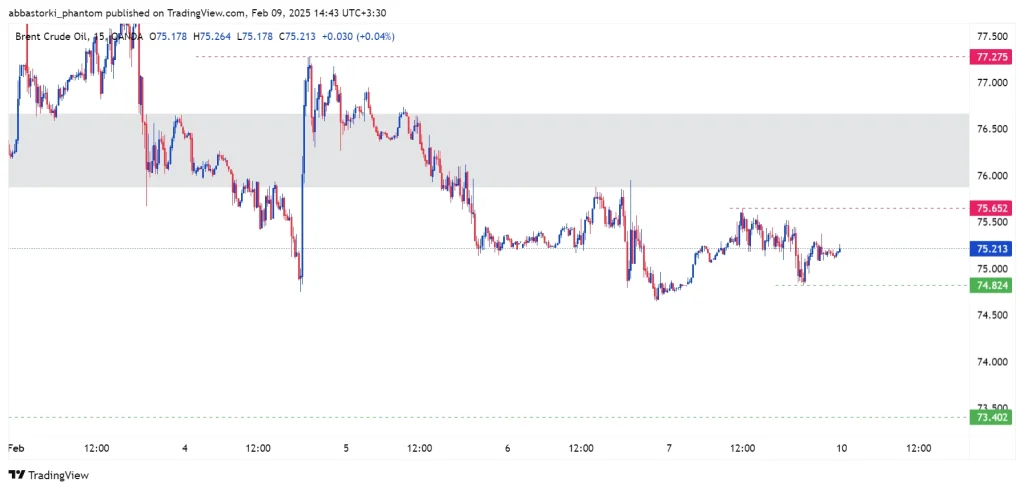
- Main Scenario: If Brent crude moves downward and breaks below $74.824, stabilizing beneath this level, the next target will be $73.402.
- Alternative Scenario: If the price rebounds and breaks above $75.652, it could move toward $77.275 as the next step.