
Bitcoin Analysis (Daily Time Frame)
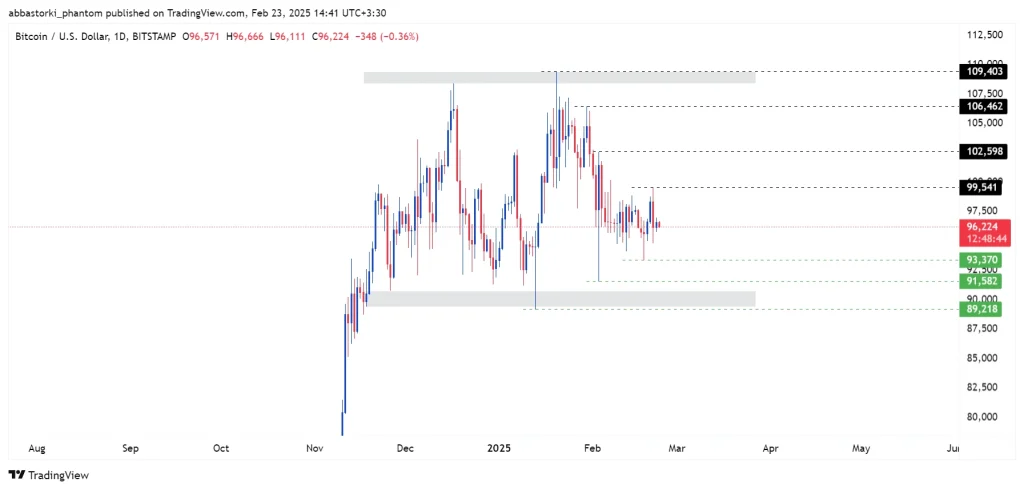
Over the past week, Bitcoin, like in previous weeks, continued to trade within its range with low volatility and showed no signs of a significant move.
Primary Scenario (Higher Likelihood):
Based on the characteristics and body of Friday’s candle, it is expected that Bitcoin will experience a downward move. After breaking the support at $93,370, the price may head toward the support zone at $91,582 or even lower, and then bounce upward from that level.
Alternate Scenario (Lower Likelihood):
If Bitcoin reverses upward from its current zone and manages to stabilize above the resistance at $99,541, it could then move toward the levels of $102,600, followed by $106,460, and eventually $109,400.
Bitcoin Analysis (4-Hour Time Frame)
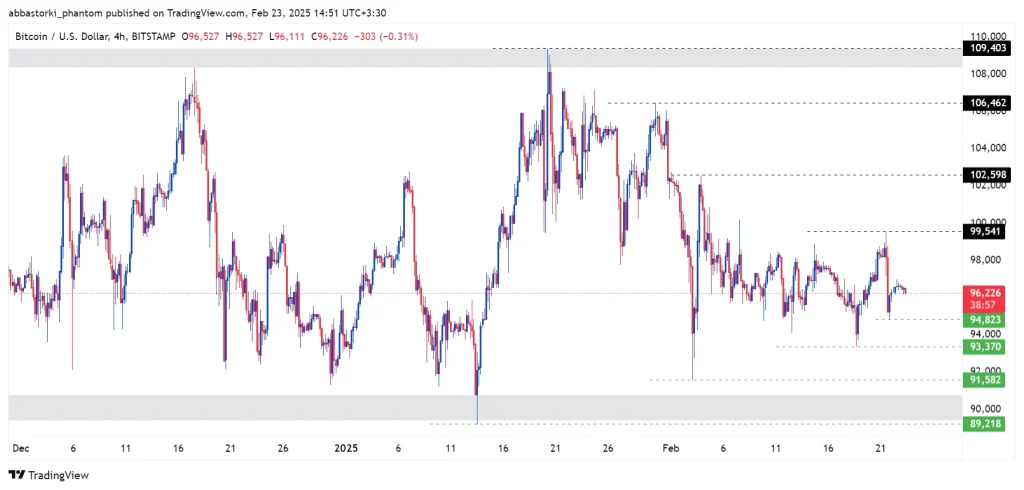
Primary Scenario:
If Bitcoin fails to secure support at its current zone—or at least near $94,800—and closes below that level, it is expected to drop at least to the zone around $91,580 or even lower, after which a rejection from that area is likely.
Alternate Scenario:
If Bitcoin finds support in its current zone, it might move toward its ultimate resistance at $99,540. After breaking and stabilizing above this level, the subsequent targets would be $102,600 and $106,460.
Bitcoin Analysis (15-Minute Time Frame)
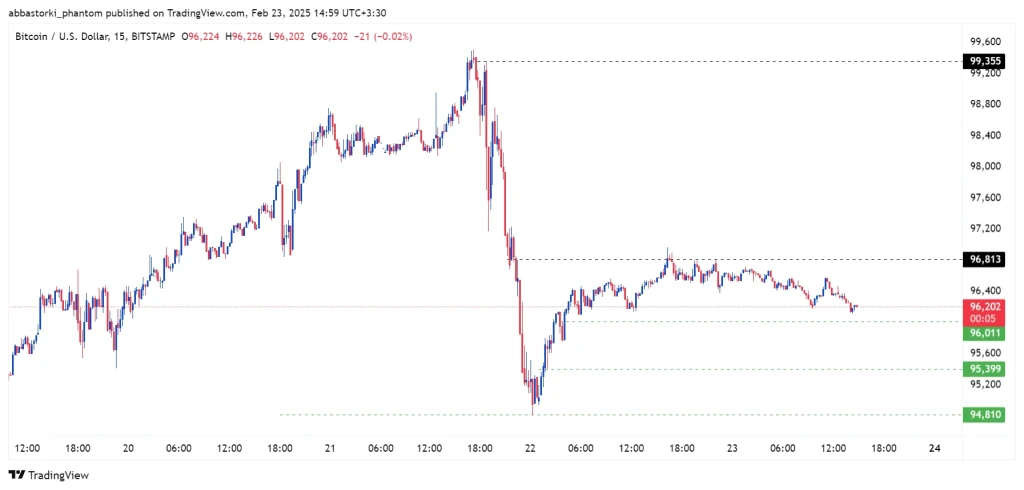
Primary Scenario:
It is expected that Bitcoin will continue its downward move slightly below $96,011. Then, it may be rejected upward from this level and head toward the key area around $96,800. If this level is broken and holds, the price could then move toward $99,355 and higher.
Alternate Scenario:
If Bitcoin loses the support at $96,011, it could continue its decline toward $95,400 or even lower.