
Global Gold Analysis (Daily Time Frame)
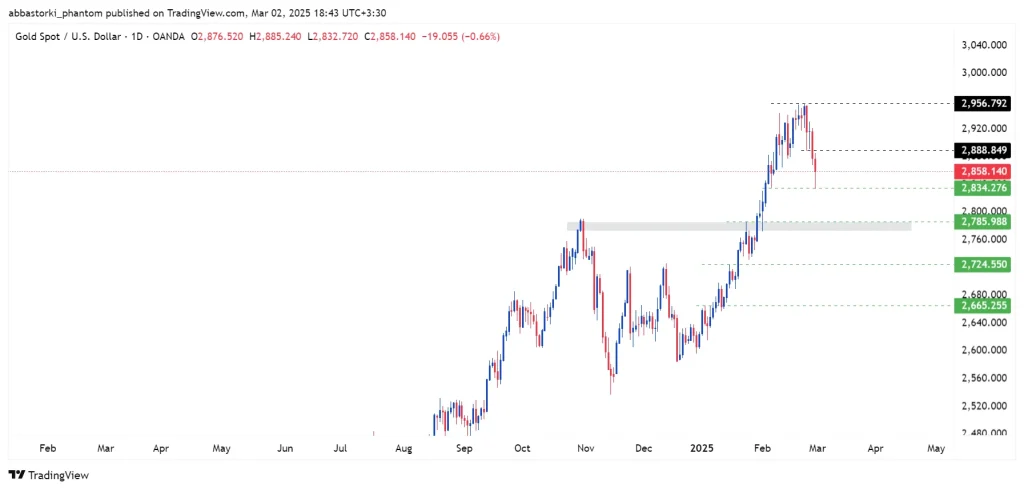
In the past week, gold formed a rising wedge pattern, clearly visible on the 4-hour timeframe, and eventually broke below its lower boundary, experiencing a decline down to the anticipated level of $2,834. The key question for this week is whether gold will attempt a recovery or continue its downtrend.
🔹 Main Scenario (Higher Probability): Given the strong bearish momentum and the type of weekly candlestick that formed last week, further decline is expected. However, before that, a temporary pullback toward $2,889 is possible. If this pullback is completed, the next bearish target will be the $2,785 – $2,780 range.
🔹 Alternative Scenario (Lower Probability): If buyers gain sufficient strength to initiate a strong bullish movement from the current area, breaking above the key $2,889 level, gold’s next target could be the historical $2,955 zone.
Gold Analysis (4-Hour Time Frame)
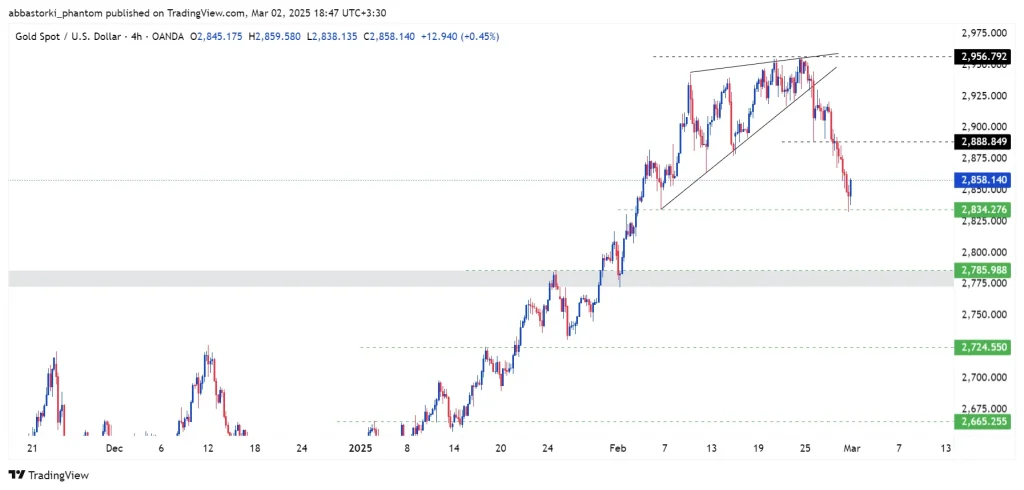
🔹 Main Scenario: Given the relatively significant support zone gold is currently in, a temporary upward retracement can be expected. If this happens, the key upside target would be $2,889.
🔹 Alternative Scenario: If the support level fails and gold breaks below this zone, the next bearish target will be $2,785.
Gold Analysis (15-Minute Time Frame)
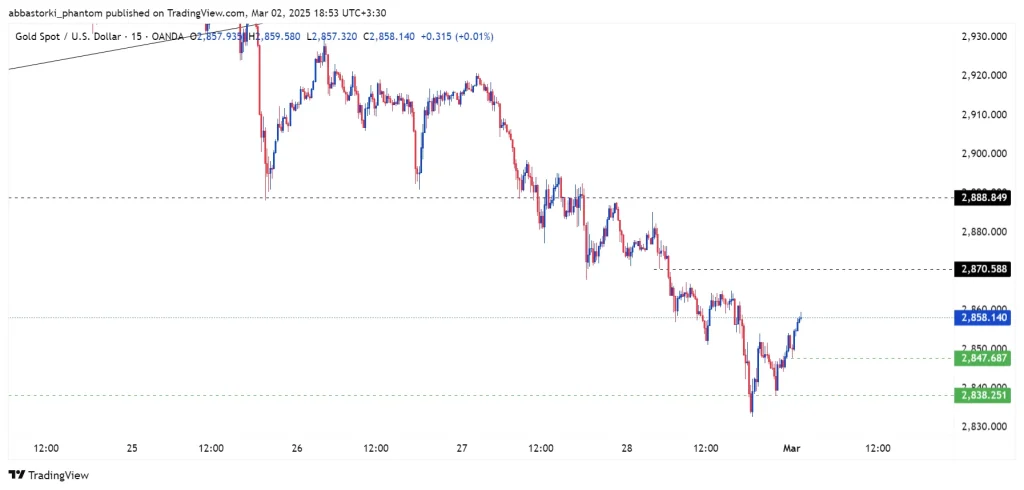
🔹 Main Scenario: Considering the current key support level and the formation of a higher low, gold is expected to move toward the $2,870 resistance level. If this level is broken, $2,889 will be the next bullish target.
🔹 Alternative Scenario: If selling pressure causes gold to decline from the current levels, breaking below the $2,847 support, the next downside targets will be $2,838 and potentially lower levels.