
Technical Analysis of Brent Oil (Daily Timeframe)
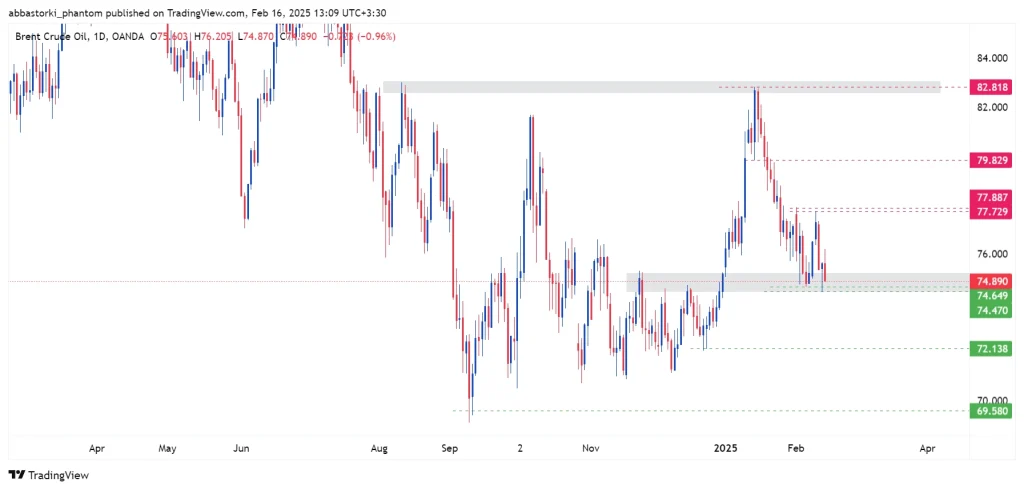
In the past week, despite starting the trading week with an upward movement, Brent crude oil failed to break through the $77.729 resistance zone. As a result, it retraced towards its previous support range of $74.649 to $74.470.
- Main Scenario (Higher Probability):
Considering the significant price zone where oil is currently positioned, it is expected that after some range-bound movement, it will be rejected from this area ($74.470 – $74.649) and move towards its previous high of $77.729. If it successfully breaks and stabilizes above this level, the next target will be $79.829. - Alternative Scenario (Lower Probability):
If oil fails to hold within the current range ($74.470 – $74.649) and closes below it, the next downward move could extend to $72.138, and possibly lower levels.
Technical Analysis of Brent Oil (4H Timeframe)
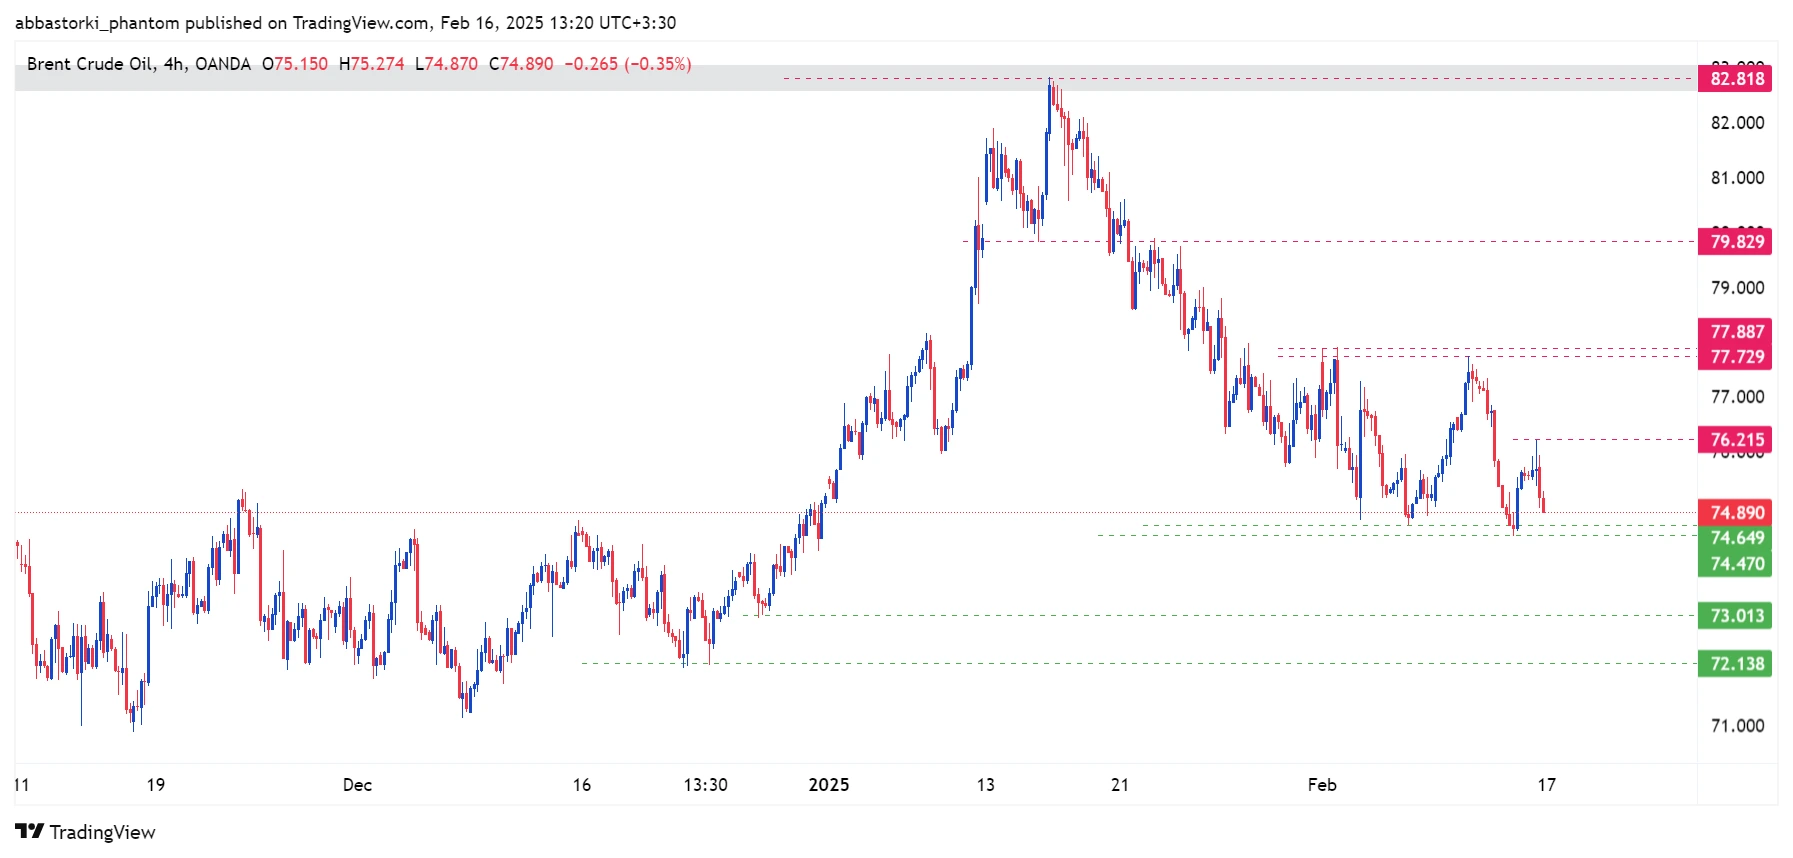
- Main Scenario:
If oil can stabilize above the $76.215 resistance, it is likely to continue its upward movement towards the previous high of $77.729. - Alternative Scenario:
If selling pressure intensifies and oil breaks the $74.649 – $74.470 range with strong momentum, the next expected target will be $73, followed by $72.138.
Technical Analysis of Brent Oil (15-Minute Timeframe)
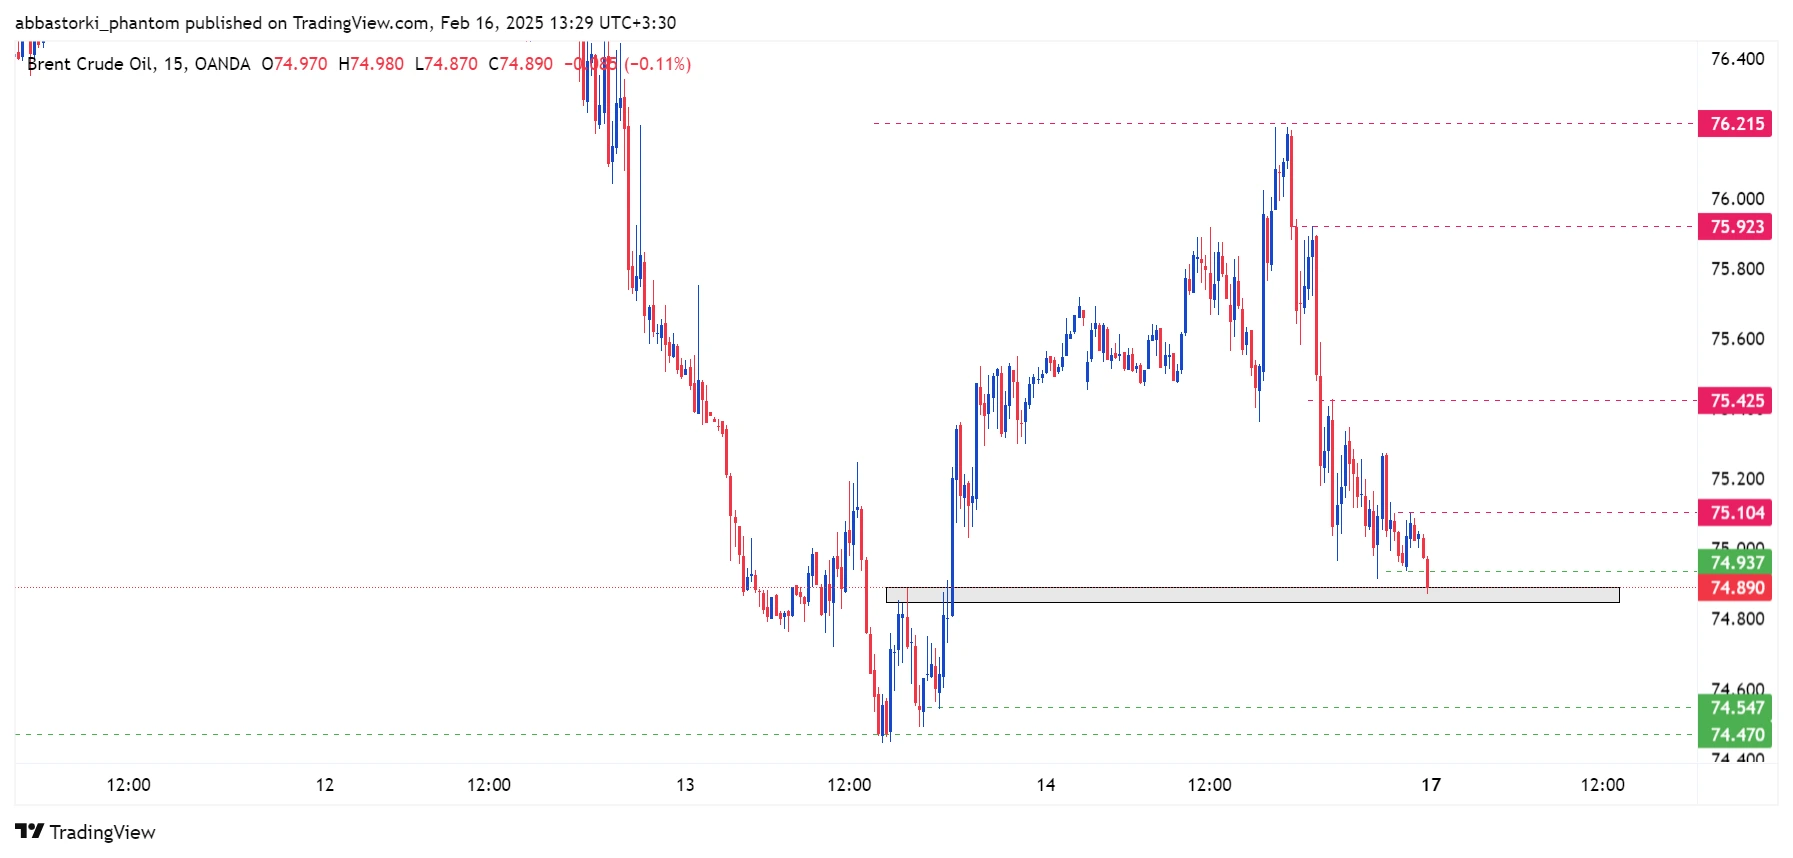
- Main Scenario:
Currently, oil is trading in a critical price zone. However, with the last candle closing below its previous low, the likelihood of further decline has increased. Therefore, it is expected to move towards $74.547 and $74.470. - Alternative Scenario:
If the current zone holds strong and buyers demonstrate their strength, the first key resistance will be $75.104. If this level is broken and confirmed above, the next potential targets will be $75.425 and $75.923.