
Technical Analysis of Brent Oil (Daily Timeframe)
Technical Analysis of Brent Crude Oil (Daily Timeframe)
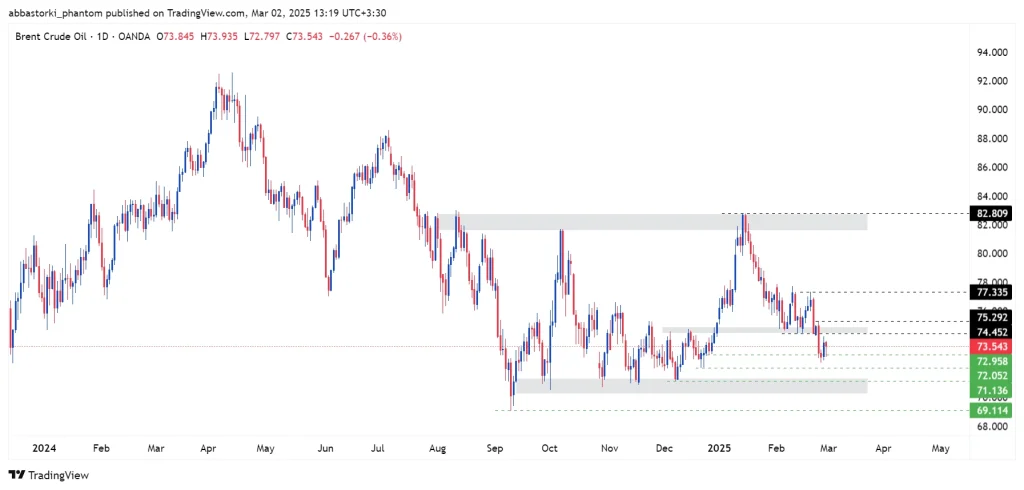
As mentioned in the primary scenario of last week’s analysis, Brent crude lost the $74.452 zone and moved towards the $73 – $72.423 range, where it temporarily found support. Now, the key question is whether the price will rebound from these critical levels or not.
🔹 Primary Scenario (Higher Probability):
Given the bearish momentum and the ATR of the bearish candles, the decline is expected to continue. If Brent breaks below the $72 level, it may further drop towards the $71.136 support and possibly reach $69.114.
🔹 Alternative Scenario (Lower Probability):
If Brent crude rebounds from the current levels and consolidates above $75.292, it could target $77.335 or even higher levels.
Technical Analysis of Brent Oil (4H Timeframe)
🔹 Primary Scenario:
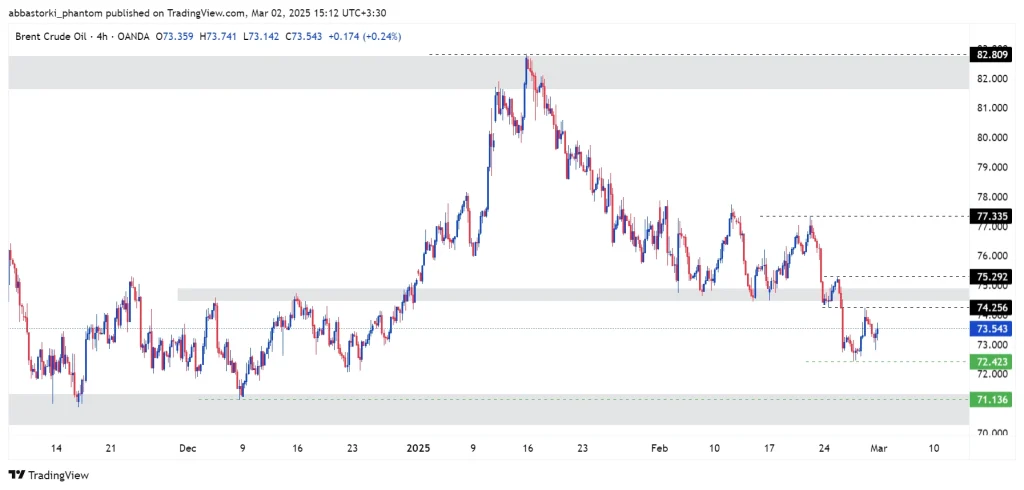
Considering the strong bearish leg, Brent crude is expected to range briefly before heading towards $72.423. If it breaks and consolidates below this level, it may continue declining towards $71.136 and potentially $69.114.
🔹 Alternative Scenario:
If Brent finds support at current levels and reverses upwards, consolidating above $75.292, it could move toward higher targets.
Technical Analysis of Brent Oil (15-Minute Timeframe)
Primary Scenario:
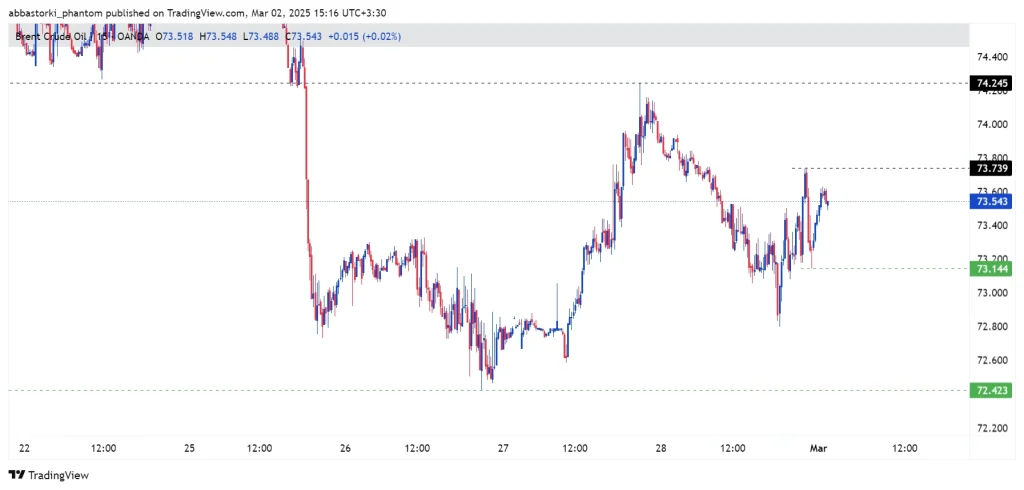
Given that the latest low is higher than the previous one, if Brent breaks and consolidates above $73.739, it could move towards $74.245.
🔹 Alternative Scenario:
If the above scenario does not materialize and the price moves downward, breaking below $73.144, the next target for Brent will be $72.423.