Bitcoin Analysis (Daily Time Frame)

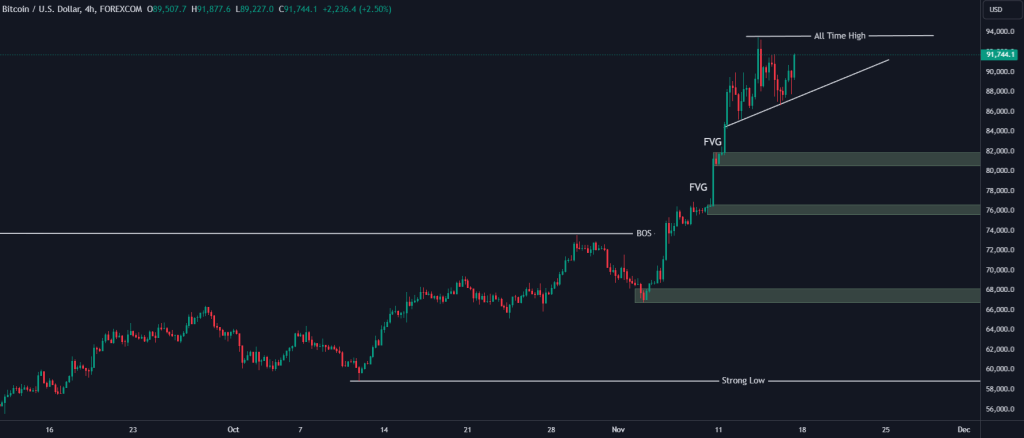
The price of Bitcoin has reached around $94,000, where, from a price-action perspective in the weekly timeframe, a price correction at this level is not unexpected. On the other hand, the chart indicates that BTC has gained significant momentum in HTF (higher timeframes) trading and is likely aiming for further increases.
Currently, entering any type of trade (buy or sell) on the Bitcoin chart involves considerable risk.
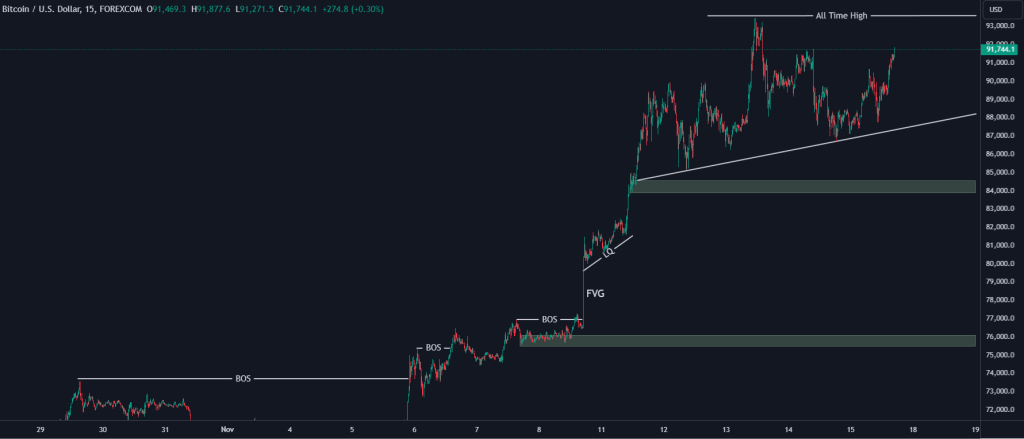
To clarify the price direction, it’s advisable to wait until the fate of the $85,000 level is determined, with a potential breakout or failure to break this level. If this level is broken, a price correction toward the $76,000 area is not out of the question.
Main Scenario: If the $85,000 demand zone is broken, the price decline is expected to continue towards the $76,000 area.
Alternative Scenario: If the price fails to stabilize below the $85,000 level, the upward movement may continue toward $99,000.
Bitcoin Analysis (4-Hour Time Frame)

An increase in price towards the $91,886 area is anticipated, followed by a price decline towards the $85,000 and $82,000 supply zones.
Bitcoin Analysis (15-Minute Time Frame)

An increase in price towards the $91,628 area is expected, with a potential rejection from this area leading to a decline toward the $88,000 range.


