
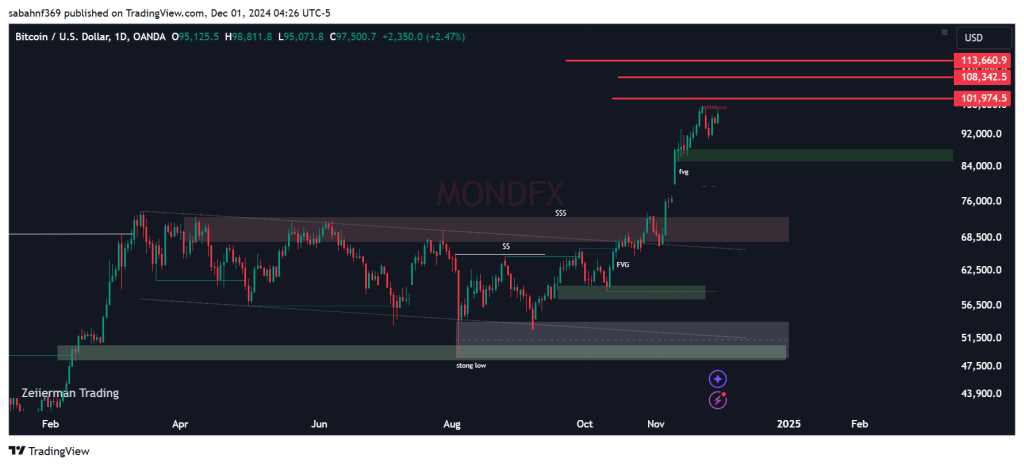
Looking at the Bitcoin chart, we can see that after a rise to $99,588 last week, the price underwent a correction and dropped to the $90,700 area. Recently, the price has risen again to $98,000. Bitcoin needs strong liquidity to break through the $100,000 resistance level.
Main Scenario:
If the price can stabilize above the $100,000 level, during price corrections to the $95,000 area, buying positions can be taken with targets at $105,000, $102,000, $108,000, and $113,000.
Alternative Scenario:
If the $100,000 level is not broken, we are likely to see initial selling pressure that could push the price down to around $88,000. Given the high number of buy orders in this demand zone, an increase in price toward higher targets could follow.
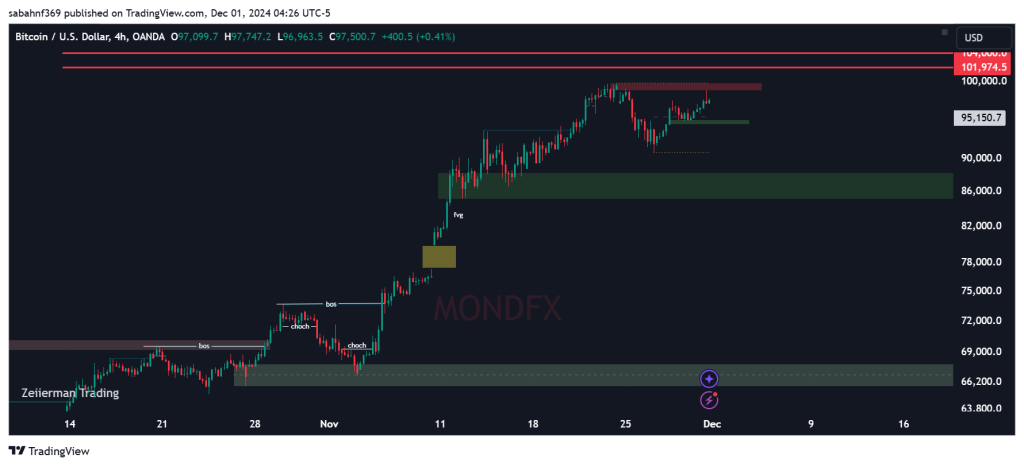
Main Scenario:
Consider buying positions during corrections above the $95,000 level, with a target at $101,975.
Alternative Scenario:
Consider selling positions during corrections in the $98,000-$99,855 range, targeting $90,704 and $88,000.
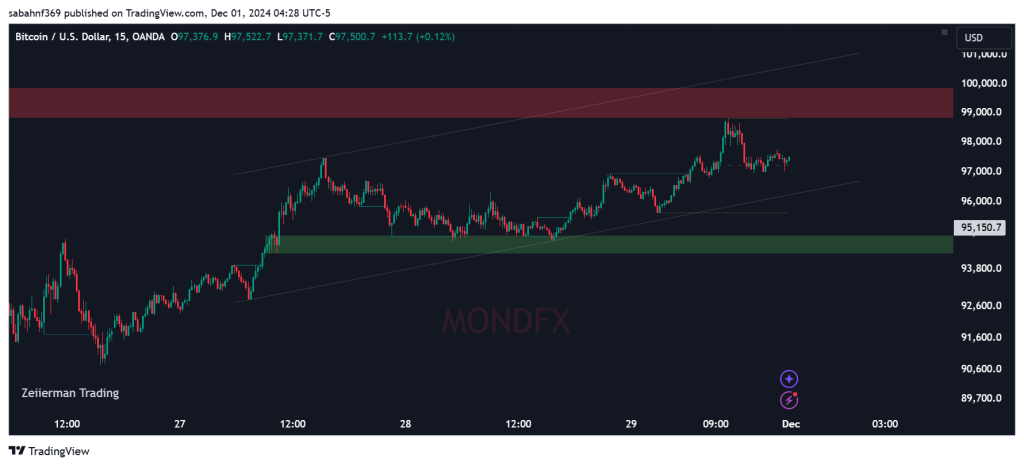
Bitcoin Technical Analysis, 15-Minute Timeframe:
During corrections in the $97,000 area, we expect a price decline to the $96,000-$95,640 zone.
During corrections in the $97,000 area, we expect a price decline to the $96,000-$95,640 zone.
share this post