
Bitcoin Analysis (Daily Time Frame)
Bitcoin Technical Analysis (Daily Timeframe)
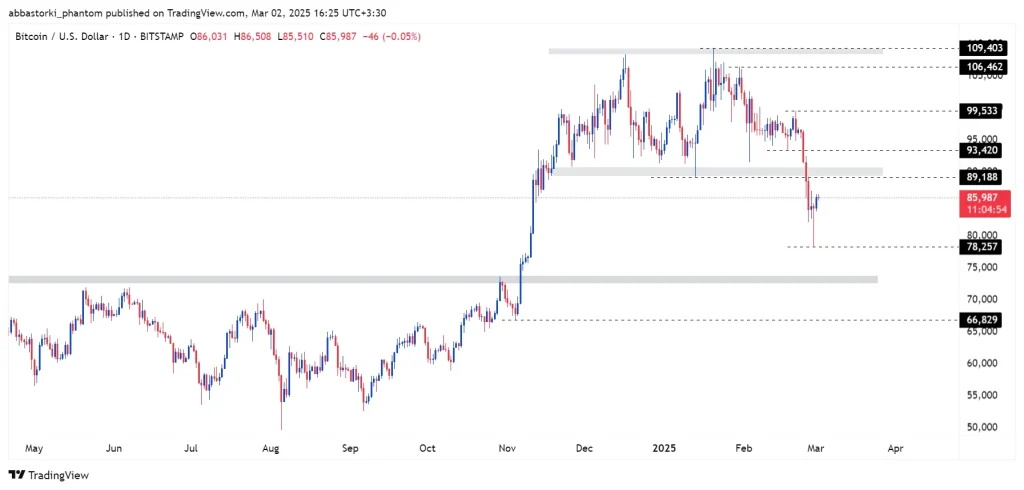
As mentioned in the primary scenario of last week’s analysis, Bitcoin showed a bearish stance and moved towards the lower range. However, this time, it successfully broke this critical level and continued towards lower targets.
🔹 Primary Scenario (Higher Probability):
With the breakdown of the key level below the range at $85,000, despite a temporary pullback, the decline is expected to continue towards the $70,000 – $75,000 range, where Bitcoin may find support.
🔹 Alternative Scenario (Lower Probability):
If the ongoing rebound continues and Bitcoin manages to reach $99,500 and consolidate above it, we can expect the correction to be over, potentially setting Bitcoin up for a move toward its all-time high and even new record highs.
Bitcoin Analysis (4-Hour Time Frame)
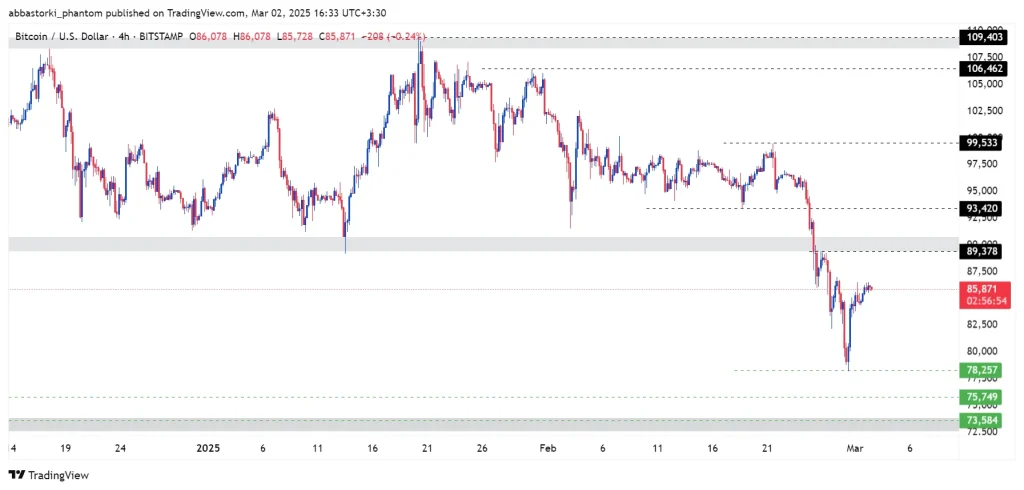
🔹 Primary Scenario:
Considering the last bearish leg, after some fluctuations in the current range, Bitcoin is expected to resume its downward movement. If it breaks below $78,250, the next support zone will be between $75,750 – $73,580.
🔹 Alternative Scenario:
If Bitcoin reverses upward and consolidates above $89,380, the next target could be $93,420, followed by $99,500.
Bitcoin Analysis (15-Minute Time Frame)
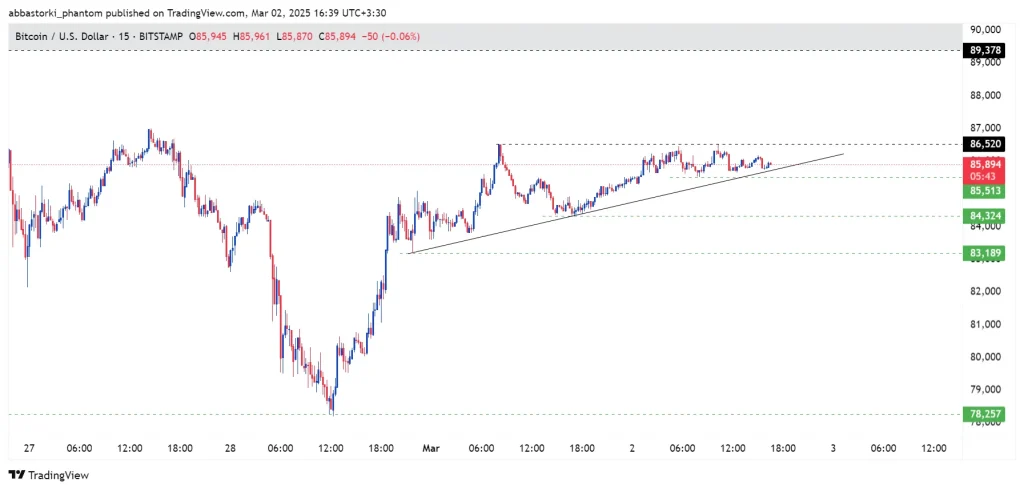
🔹 Primary Scenario:
If Bitcoin breaks and consolidates above $86,500, the next target will be $89,380.
🔹 Alternative Scenario:
If Bitcoin strongly breaks below $85,500 and stabilizes beneath this level, the next downside targets will be $84,300 and $83,200.