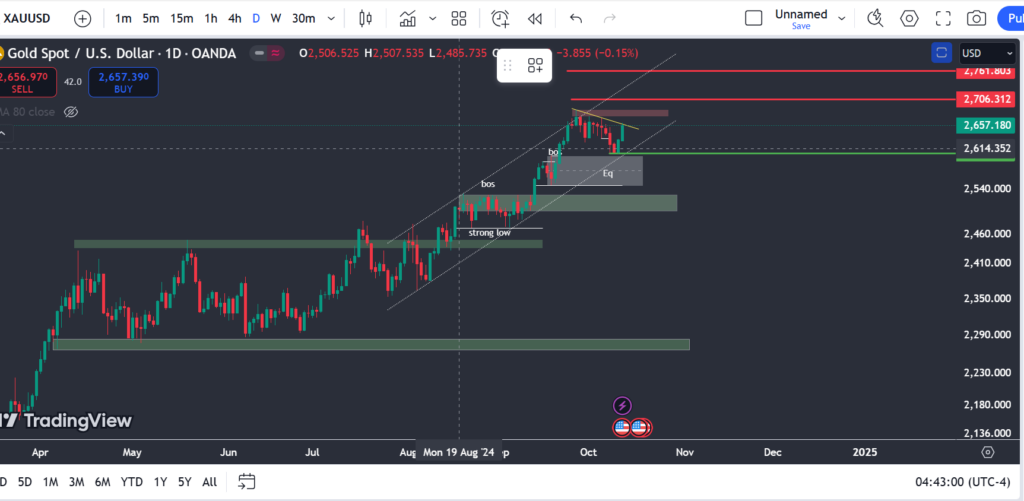
Global Gold Analysis (Daily Time Frame)
Global gold prices are showing an upward outlook, influenced by numerous factors including geopolitical conditions, interest rates, dollar strength, and global economic indicators. In the daily time frame, after reaching the 618 Fibonacci level and forming a bullish engulfing candle, there is a possibility of price increasing to the levels of 2674, 2685, and subsequently 2706, 2735. As long as the price remains above the 2604 level, the daily trend can be considered bullish. A break below this area may lead to a price drop to the range of 2574–2548.

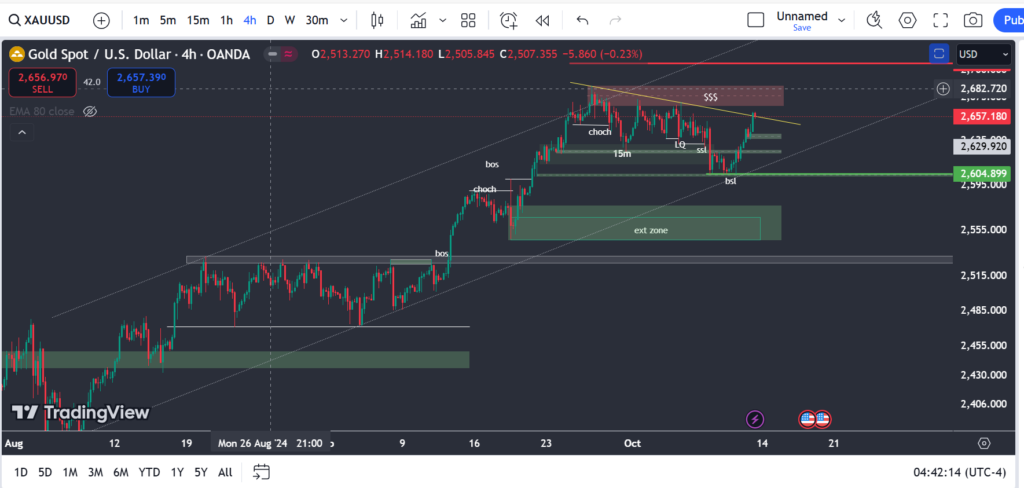
In the 4-hour time frame, after hitting the bottom of the ascending channel and the lower time frame order block, gold has re-entered a bullish phase, with expected price increases to the areas of 2676 and 2685. A potential scenario is liquidity hunting at the trend line and then a price drop to the levels of 2640, 2624; if the 2604 area is broken, a further drop to 2580 will follow. If the 2685 level is broken and price stabilizes above this level, we expect a price increase to 2735.
Gold Analysis (4-Hour Time Frame)

In the 4-hour timeframe, gold has entered a trading range after a strong upward trend and formed a wedge pattern. The 2625 area is a crucial support level; if this support is lost, gold may fall to the 2576, 2566, and ultimately 2538 levels. The green areas marked on the chart are valuable for buy trades.
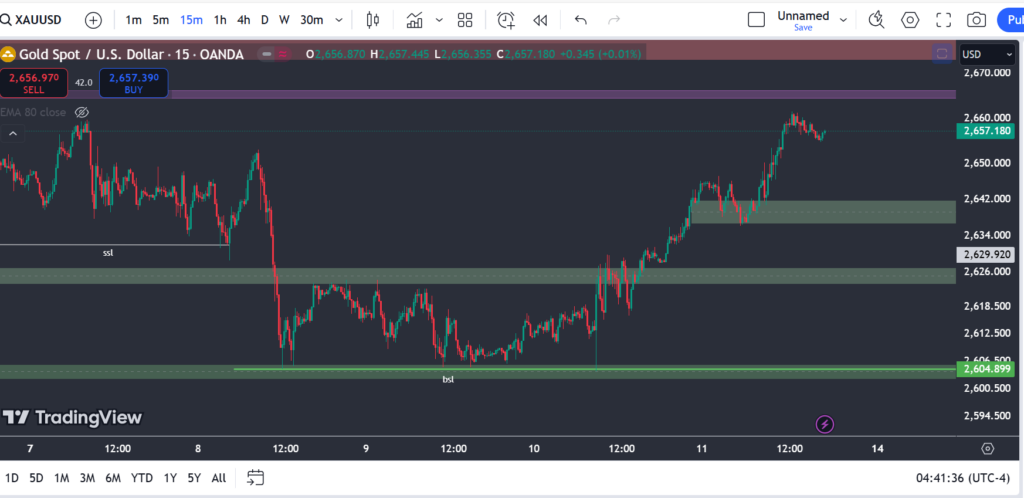
Gold Analysis (15-Minute Time Frame)

In the 15-minute time frame, there is bullish momentum, expecting an increase in price to the level of 2665 (purple order block) and a subsequent drop from this level to 2647 and 2637. The green highlighted areas are valuable for gold buy trades.


