
Global Gold Analysis (Daily Time Frame)
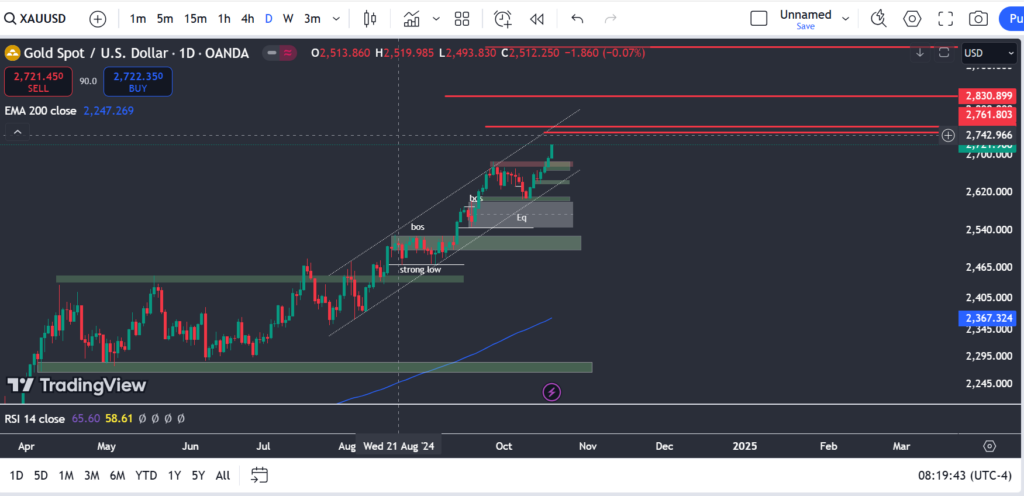
In the past week, gold continued its strong upward trend. With a full-bodied bullish candle closing on the weekly and daily charts, it has firmly established the case against sellers, reinforcing the continuation of gold’s rise toward new price highs. After breaking through the previous range high, gold has formed a new upward range, rising to the 2721 level.
We anticipate a price correction into the depth of the breakout area (the Des flip zone on the chart), from which we will again enter buy positions. The green zones marked on the chart indicate valuable areas for gold trades aimed at reaching price targets of 2749, 2761, and 2830.
Gold Analysis (4-Hour Time Frame)
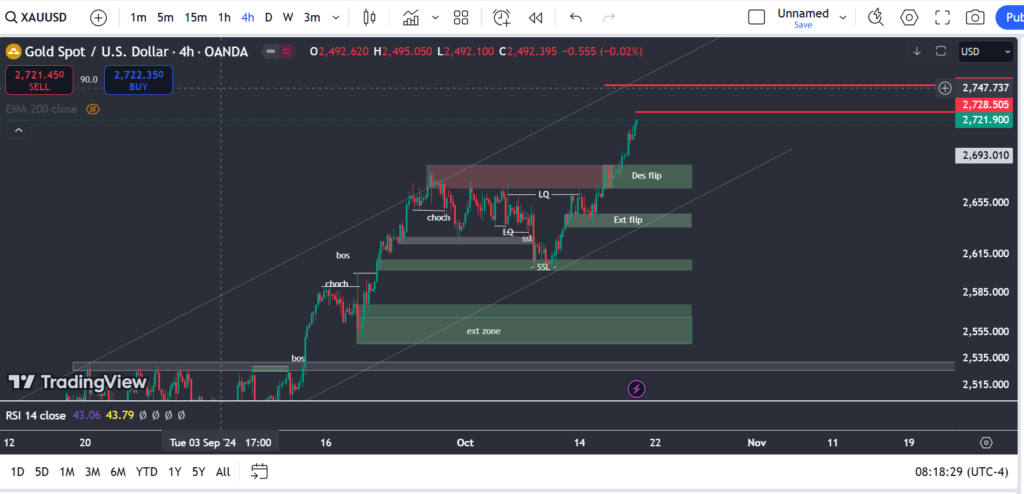
Gold is approaching the upper boundary of its upward channel. If the price breaks above the 2701 level, a decline to the range of 2686-2665 will follow, where buy positions can be considered. The next target for gold in buy trades is between 2746 and 2750.
If the price declines and breaks the 2667 level, the next targets could be the 2646 and 2600 levels.
Gold Analysis (15-Minute Time Frame)
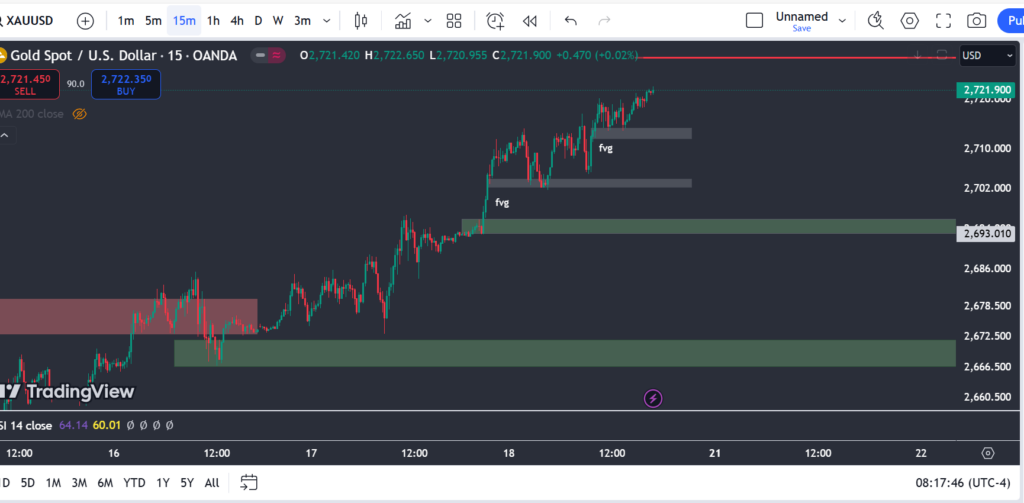
Gold is currently within a compressed upward channel. We expect an increase in price to the 2728 level, followed by a decline to around 2714. If this area is broken, the next price targets will be 2704 and 2696. The marked green areas indicate valuable entry points for buy positions.