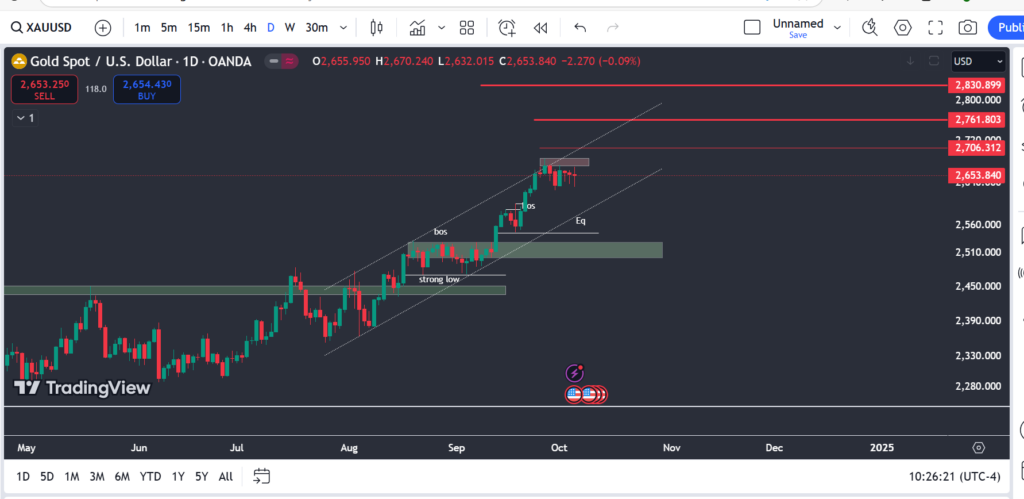
Global Gold Analysis (Daily Time Frame)
Last week, the gold price faced severe fluctuations as tensions in the Middle East and U.S. employment reports drove prices towards both complete collapse and new historical highs. However, by the end of Friday, gold prices were nearly at the same level as at the start of the week, as upward and downward pressures neutralized each other. The non-farm payroll report increased U.S. Treasury yields and the dollar, indicating a gradual or moderate reduction in interest rates in the future. Typically, this is enough for a bearish forecast for gold prices, but considering the current global turmoil and the approach of the U.S. elections, volatility and instability could provide support for gold.

Gold is in a strong upward channel on the daily timeframe. After hitting the channel’s ceiling, it has entered a trading range. If the price declines and breaks below 2625, it could drop to 2615. The next targets for gold in case of a decline are 2600, 2576, and 2537. The 2600 to 2579 range is considered a valuable area for buy trades to achieve targets of 2686, 2703, and 2761.
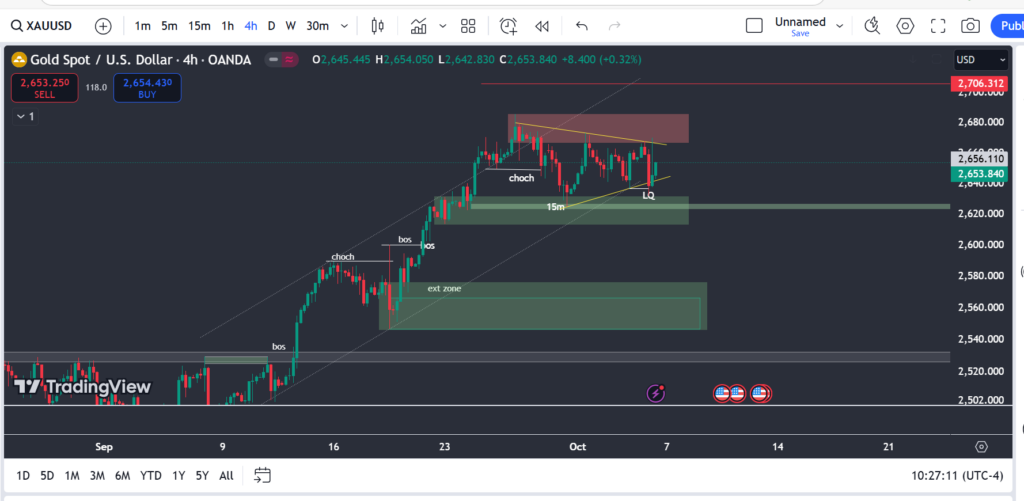
Gold Analysis (4-Hour Time Frame)

In the 4-hour timeframe, gold has entered a trading range after a strong upward trend and formed a wedge pattern. The 2625 area is a crucial support level; if this support is lost, gold may fall to the 2576, 2566, and ultimately 2538 levels. The green areas marked on the chart are valuable for buy trades.
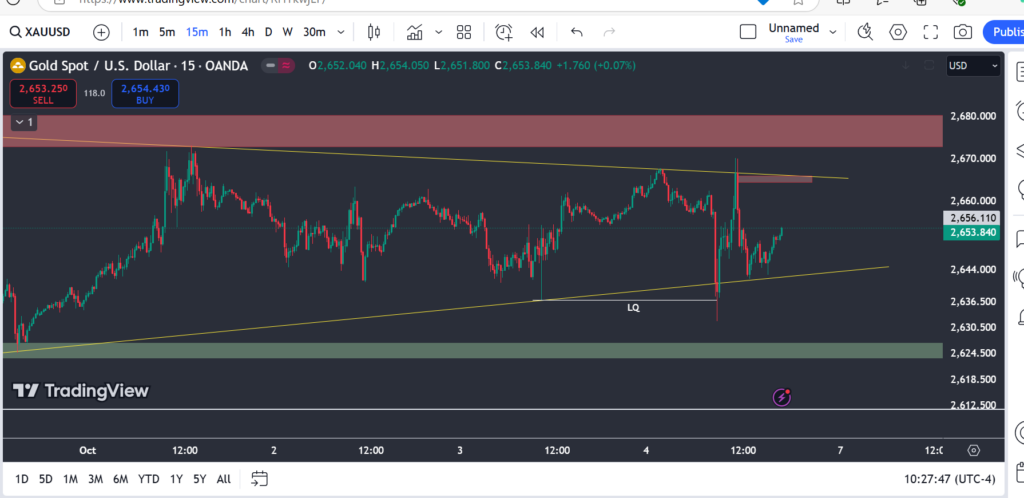
Gold Analysis (15-Minute Time Frame)

Gold is in a range in the 15m timeframe, and after a liquidity sweep and order collection, it has risen again, creating liquidity with back-and-forth movements. There is a possibility of price rising to the 2664-2666 range and then declining again to 2635. Until the price breaks either of the support and resistance levels of the range, back-and-forth movements are expected.


