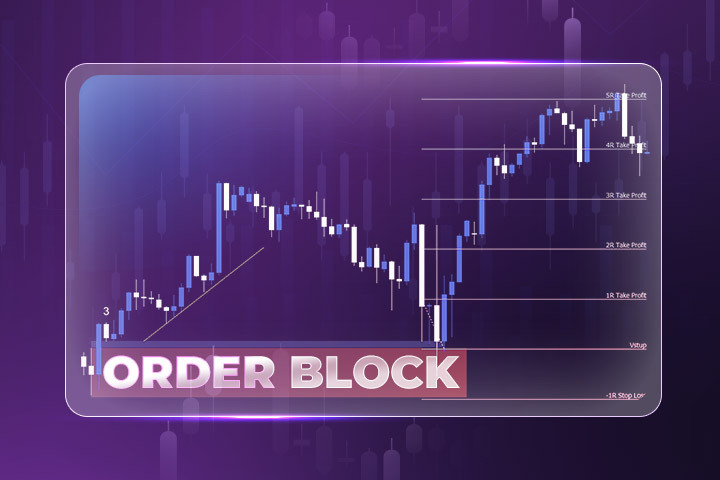
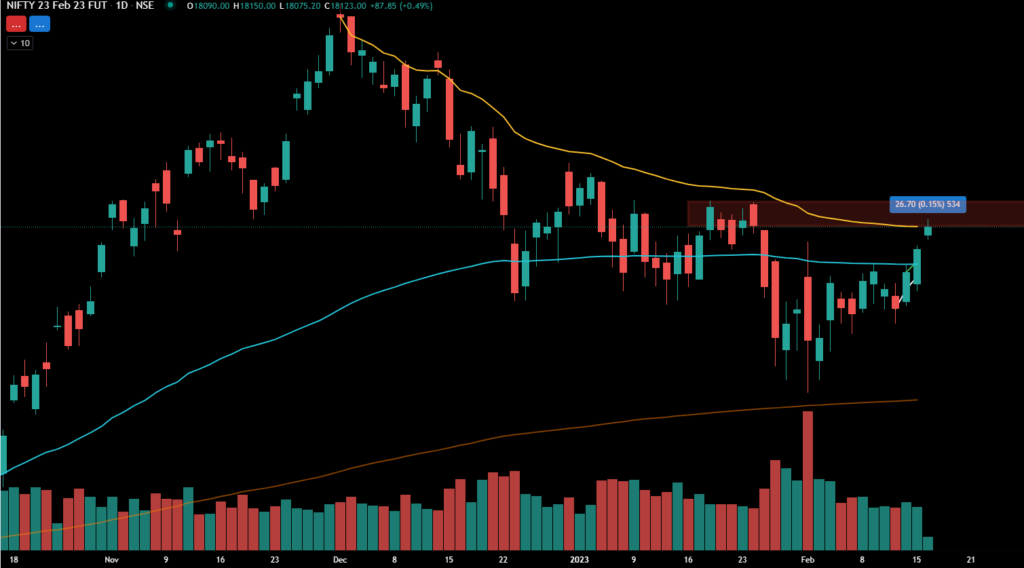
An Order Block refers to an area in the price chart that is recognized as a significant region for technical analysis and trading decisions. These areas represent clusters of buy or sell orders created by major market players, such as banks and financial institutions.
An Order Block forms when the price changes direction multiple times within a specific range. These directional changes indicate the presence of numerous buy and sell orders in that area. In other words, Order Blocks are regions where the price experiences strong resistance or support.
Importance of Order Blocks in Technical Analysis
Order Blocks are recognized as potential price reversal areas. This means that after a strong price movement, there is a likelihood of the price returning to these areas. Technical analysts use Order Blocks to identify potential support and resistance levels. Additionally, these regions can be considered as suitable entry or exit points for trades.
Order Blocks are powerful tools for technical analysis and can help traders make better decisions. However, like any other tool, the correct use of Order Blocks requires sufficient experience and knowledge.
Types of Order Blocks
In technical analysis, Order Blocks are important areas in the price chart that indicate the concentration of buy or sell orders within a specific price range. Recognizing the different types of Order Blocks can help traders identify potential support and resistance levels and make better trading decisions. Here are the types of Order Blocks:
- Bullish Order Block
A Bullish Order Block forms when the price reaches a specific price range after a downtrend and encounters buying pressure. In this area, a significant number of traders have placed buy orders, causing the price to stall or even reverse. Bullish Order Blocks act as potential support levels and can be a suitable entry point for buyers.
- Bearish Order Block
In contrast to a Bullish Order Block, a Bearish Order Block forms at the end of an uptrend. In this case, the price reaches a specific price range and encounters selling pressure. The accumulation of sell orders in this area causes the price to stall or even reverse. Bearish Order Blocks act as potential resistance levels and can be a suitable entry point for sellers.
- Breaker Block
A Breaker Block is a type of Order Block that forms against the main trend. In other words, if the main trend is bullish, the Breaker Block will be bearish, and vice versa. This type of Order Block indicates a potential trend change and can serve as an important signal for traders.
- Rejection Block
A Rejection Block is another type of Order Block where the price sharply reverses after hitting a price level. This indicates strong supply or demand in that area. Rejection Blocks often act as stronger support or resistance levels.
- Vacuum Block
A Vacuum Block refers to an area in the chart where the price moves rapidly without showing any reaction. This type of block is generally considered less significant compared to other types of Order Blocks and is often seen as a weak signal.
Ultimately, it is important to note that Order Blocks are just one of the tools in technical analysis and should not be used in isolation for trading decisions. Combining Order Blocks with other indicators and price patterns can enhance the accuracy of analysis.
How to Identify Order Blocks in the Crypto Market?
To identify Order Blocks, several methods can be employed:
- Price Range
The first step in identifying Order Blocks is recognizing a price range where the price has oscillated for some time. This range is usually referred to as a range.
- Range Breakout
After forming a price range, the price must break out of this range with strength. If the price breaks upward, a bullish Order Block is likely, and if it breaks downward, a bearish Order Block is likely to have formed.
- Candle Confirmation
To confirm an Order Block, a strong candle is usually needed. This candle should have a large body and short shadows. It is also preferable for this candle to move against the breakout direction.
- Volume Analysis
Analyzing trading volume in the Order Block area can provide useful insights. High trading volume in this range usually indicates its significance.

How to Mark Order Blocks:
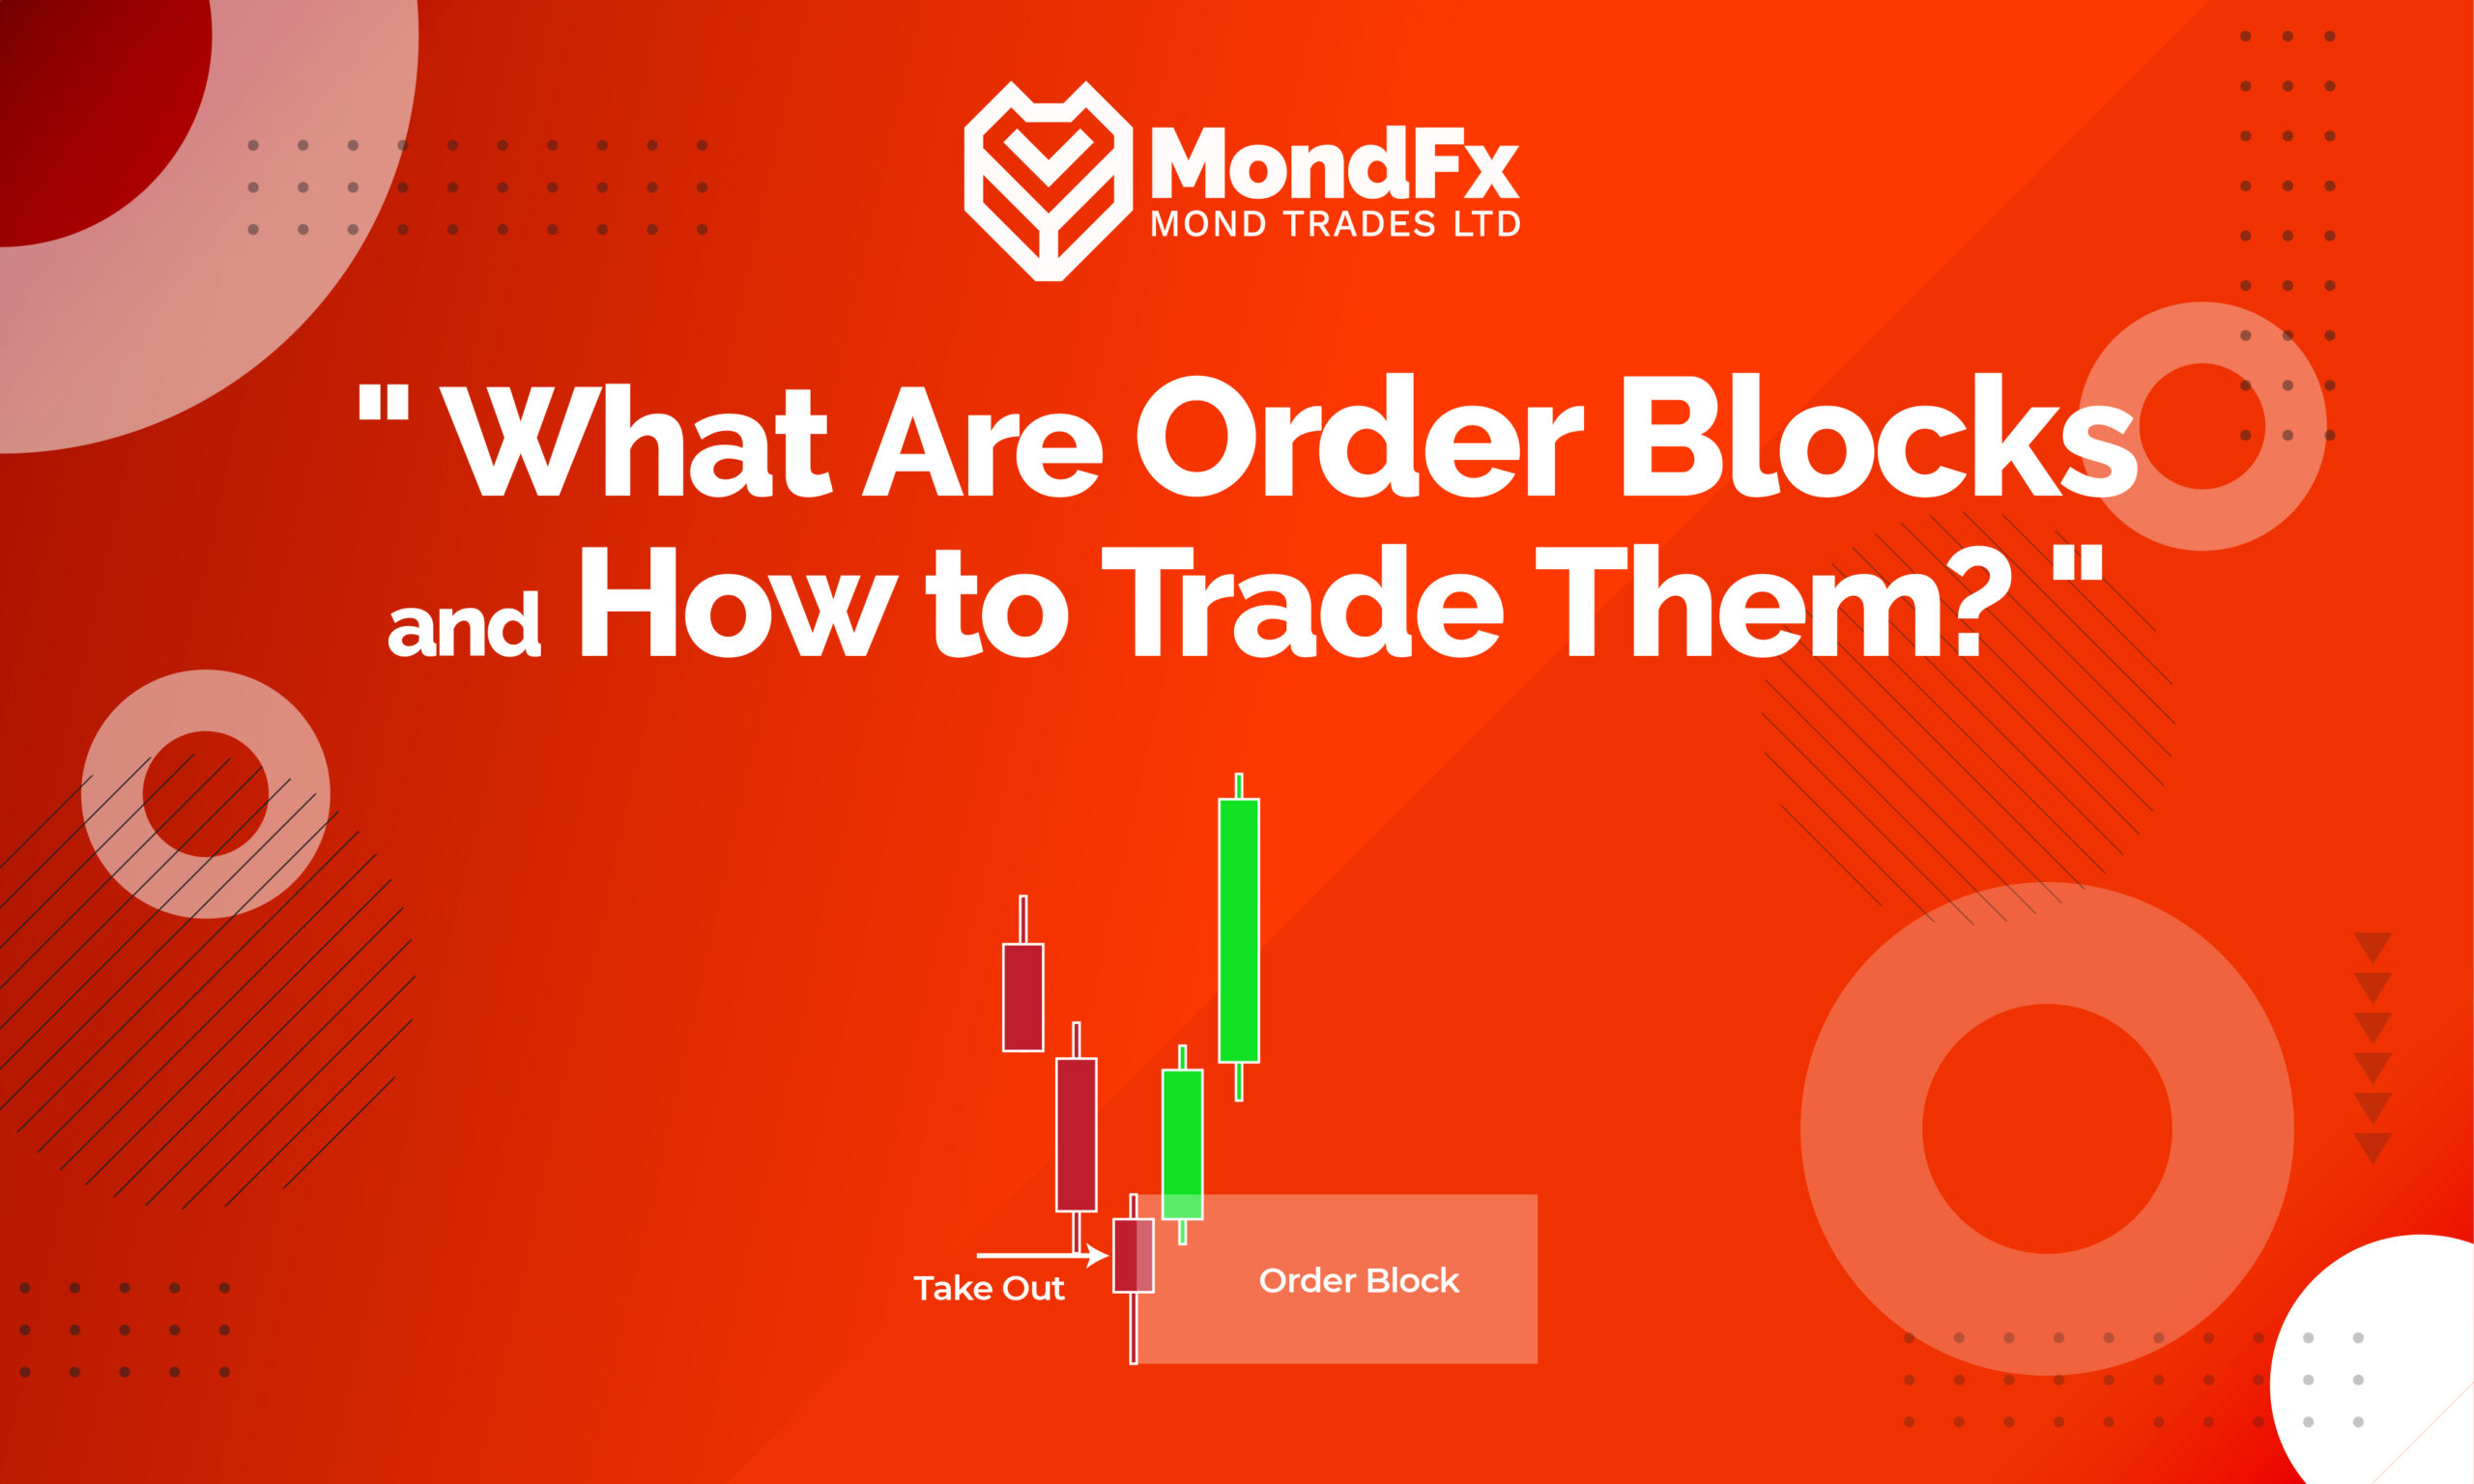
To identify a bullish Order Block, mark the highest (High) and lowest (Low) prices of the last bearish candle before a bullish movement with horizontal lines. In the case of a bearish Order Block, consider the highest and lowest prices of the last bullish candle before a bearish movement as the Order Block range.
However, this definition is just a simple introduction to Order Blocks, and more in-depth analysis is necessary for professional trading. Many candlestick patterns resemble Order Blocks but do not necessarily have the potential to create a strong price movement. To identify valid Order Blocks and increase the likelihood of success in trades, attention must be paid to other factors, which we will discuss next.
Differences Between Order Blocks and Regular Supply and Demand Areas: A Deep Dive
In technical analysis, the concepts of supply and demand areas and Order Blocks are often used interchangeably. However, despite their similarities, these two concepts have significant differences that are essential for more accurate market analysis.
Supply and Demand Areas:
Supply and demand areas are simply areas in the price chart where selling pressure (supply) or buying pressure (demand) has been dominant. These areas can act as potential support and resistance levels. In other words, when the price approaches these areas, the likelihood of a directional change or slowdown in the trend increases.
Characteristics of Supply and Demand Areas:
– Determined by Price Behavior: Supply and demand areas are usually identified by examining past price behavior and pinpointing where the price has reacted.
– Flexibility: These areas can change with market conditions and may gradually shift.
– Relative Importance: The significance of supply and demand areas varies based on factors such as trading volume, duration of formation, and other technical indicators.
Order Blocks
Order Blocks are also a type of supply and demand area but have their specific characteristics. These areas indicate the concentration of large buy or sell orders within a specific price range. In other words, in Order Blocks, many traders have collectively decided to buy or sell at a specific price.
Characteristics of Order Blocks:
– Accumulation of Large Orders: Due to the high volume of orders, Order Blocks typically have a stronger impact on price.
– Higher Reversal Probability: One of the main differences between Order Blocks and regular supply and demand areas is the higher probability of price reversal from these areas. This means that after the price touches an Order Block, the likelihood of trend reversal and price returning toward it is much higher.
– Greater Stability: Order Blocks are generally more stable than regular supply and demand areas and are less likely to shift.
Key Differences
Feature
|
| Order Blocks | ||
Definition | Areas where buying or selling pressure is dominant | Areas where large buy or sell orders accumulate | ||
Reversal Probability | Lower | Higher | ||
Stability | Lower | Higher | ||
Impact on Price | Lower | Higher |
While both supply and demand areas and Order Blocks serve as support and resistance levels, Order Blocks are more significant due to the high volume of orders and higher likelihood of reversals. Accurately identifying and properly utilizing Order Blocks can help traders make more precise trading decisions.

Change of Character in Order Blocks
Change of Character (CHOCH) is an important concept in technical analysis, especially regarding Order Blocks. This term refers to a change in price behavior within a specific price range.
Importance of Change of Character
Order Blocks are areas where there is a concentration of buy or sell orders. When the price reaches these areas, it usually encounters resistance or support. However, sometimes the price simply breaks through instead of bouncing back. This change in price behavior is referred to as Change of Character.
– Bullish Change of Character: If the price breaks through a bearish Order Block instead of reversing and continues its upward trend, this change in behavior is called a bullish Change of Character. This indicates weakness in the bearish Order Block and increasing strength of buyers.
– Bearish Change of Character: Conversely, if the price breaks through a bullish Order Block instead of reversing and continues its downward trend, this change in behavior is referred to as a bearish Change of Character. This indicates weakness in the bullish Order Block and increasing strength of sellers.
Importance of Change of Character in Trading:
Accurately identifying Change of Character can provide excellent trading opportunities. By recognizing this change in behavior, traders can enter the market in the direction of the new trend and potentially achieve higher profits.
Finally, it is important to note that Change of Character is a technical analysis tool, and like other tools, it cannot guarantee precise trading decisions on its own. Combining it with other analysis methods and risk management can enhance the likelihood of success in trading.
How to Trade Order Blocks?
The first step in trading with Order Blocks is to accurately identify these areas. Order Blocks typically form at the end of a specific price movement. For example, a bullish Order Block forms at the end of a downtrend, and a bearish Order Block forms at the end of an uptrend.
Determining the Order Block Range: To identify the Order Block range, consider the highest and lowest prices of the candle at the end of the trend. These two points define the Order Block range.

Trading Strategies:
Once an Order Block is identified, various strategies can be employed for entering trades:
- Trading on Price Reversal: One of the most common strategies is to wait for the price to return to the Order Block range. If the Order Block is bullish, it is expected that the price will return to this range after a downward movement. At this point, a buy signal can be considered. A similar approach applies for bearish Order Blocks.
- Order Block Breakout:
In some cases, the price may break through the Order Block range. This can indicate a trend change. In such situations, a sell signal can be considered for a breakout of a bullish Order Block and a buy signal for a breakout of a bearish Order Block.
Combining with Other Indicators: To increase the likelihood of success, Order Blocks can be combined with other technical analysis tools such as trend lines, moving averages, and oscillators. This can help confirm trading signals.
Risk Management Like any other trading strategy, risk management is crucial when trading with Order Blocks. Setting appropriate stop-loss and take-profit levels can prevent significant losses and enhance the profitability of trades.
Conclusion The Order Block strategy, as one of the commonly used methods in technical analysis, has a high potential for achieving profitability in trades. Accurately identifying supply and demand areas (Order Blocks) and utilizing a favorable risk-to-reward ratio are among the advantages of this strategy. However, mastering this method requires patience and careful analysis of charts, along with accurately identifying key market areas.
It is important to note that financial markets are always accompanied by volatility and unexpected events. Therefore, strictly adhering to capital management principles and adapting the strategy to changing market conditions is of particular importance.
To increase the likelihood of success, it is recommended to use the Order Block strategy as a complementary tool alongside other technical analysis methods. Combining this strategy with other analytical techniques can lead to improved decision-making accuracy and overall trading performance. However, due to the limited nature of trading areas identifiable using Order Blocks, it should not be relied upon as the primary strategy or the sole source of trading decisions.


